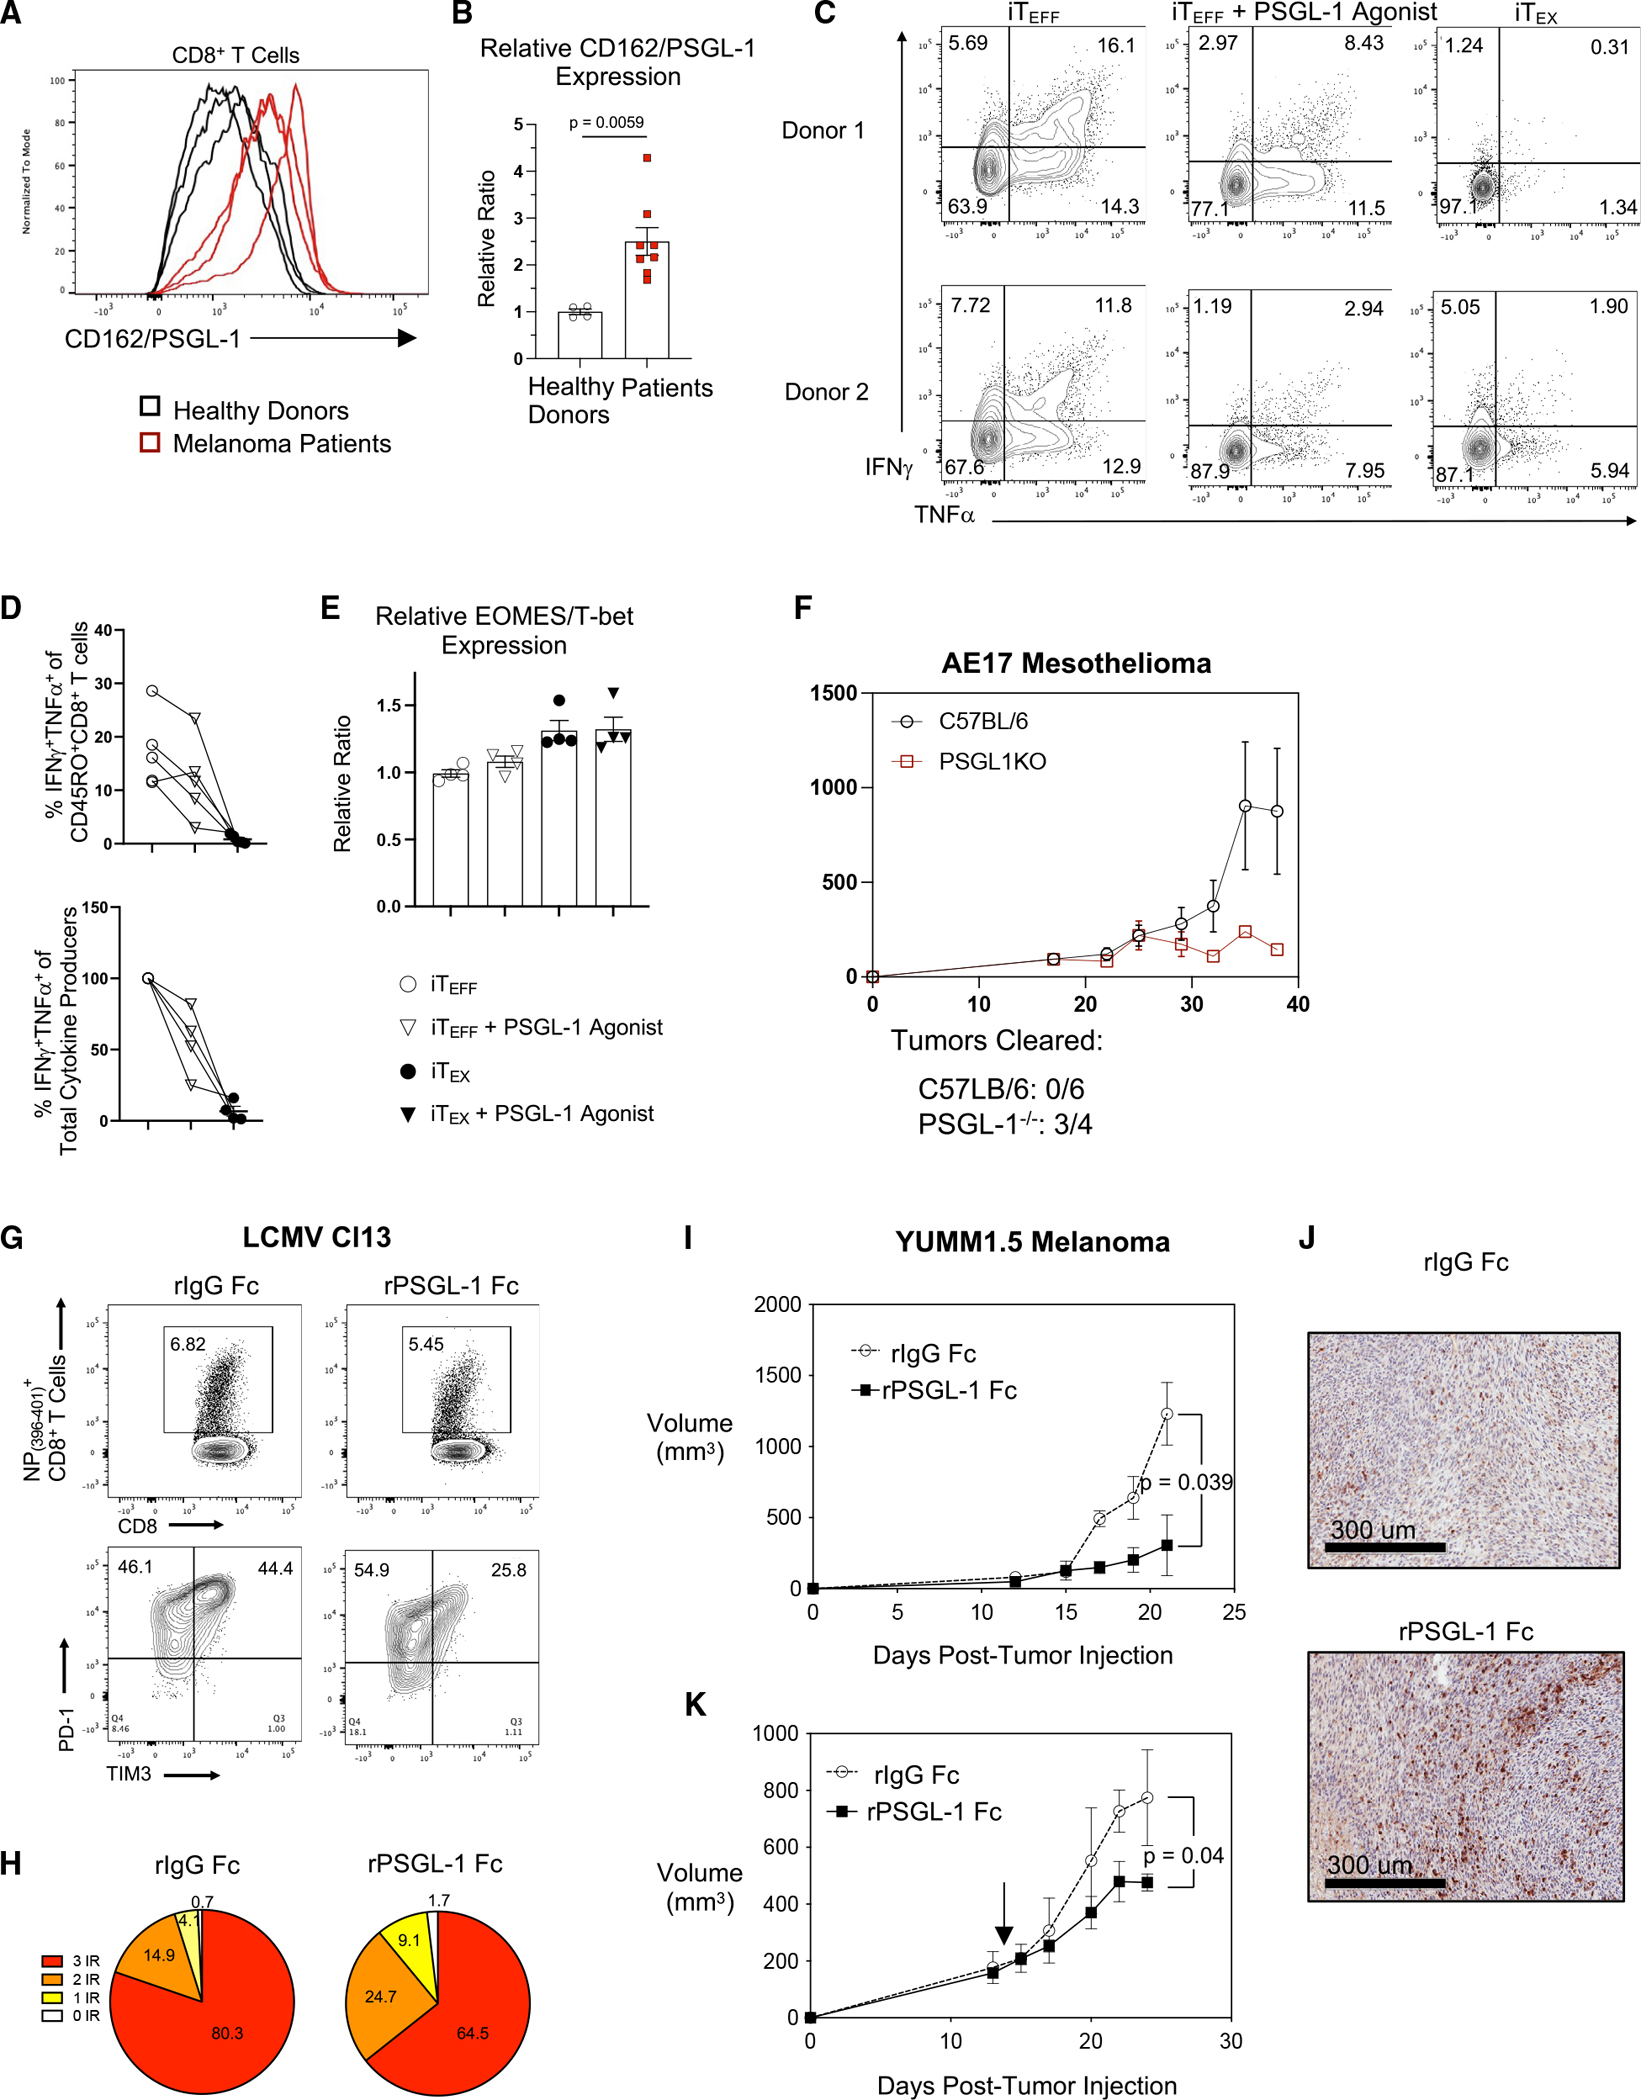
Figure 7. Pharmacological inhibition of PSGL-1 promotes decreased T cell exhaustion and functional T cell responses.

(A) Histograms of CD162/PSGL-1 expression on activated CD8+ T cells from 3 healthy donors and 3 patients with melanoma.
(B) Relative expression of PSGL-1 on CD8+ T cells from healthy donors and patients with melanoma.
(C–E) PBMCs from healthy donors were assessed for transcription factor expression or restimulated to assess cytokine production.
(C) Flow cytometry plots showing IFNγ and TNF-α production by CD8+ T cells from two different healthy donor PBMCs after iTEFF or iTEX culture and restimulated on day 9; pre-gated on live, CD8+CD45RO+ cells.
(D) Top: frequencies of IFNγ and TNF-α double-producing CD8+CD45RO+ cells cultured under iTEFF, iTEFF + PSGL-1 agonist, or iTEX conditions. Lines are connecting data from the same donor under the different culture conditions. Bottom: relative reduction of IFNγ and TNF-α double-producing CD8+CD45RO+ cells upon PSGL-1 ligation under iTEFF conditions (4 out of 5 donors).
(E) EOMES/T-bet expression ratio in CD8+CD45RO+ cells from donors in (D).
(A–E) Each dot represents a unique donor. Experiments were performed 2× (A and B) or 3× (C–E). Data are parametric data; unpaired t tests were performed. Error bars are SEM.
(F) Growth (volume) of AE17 mesothelioma tumors in C57BL/6 and PSGL-1−/− mice.
(G) Top: splenic NP(396–404)-specific CD8+ T cells of control- and recombinant PSGL-1-human Fc protein (rPSGL-1 Fc)-treated LCMV Cl13-infected mice assessed on 8 dpi. Bottom: PD-1 and TIM-3 expression on NP(396–404)-specific CD8+ T cells.
(H) Co-expression of PD-1, LAG3, and TIM-3 on NP(396–404) specific CD8+ T cells assessed via Boolean gating.
(I) Growth of YUMM1.5 tumors in control C57BL/6 mice and mice treated with rPSGL-1 Fc beginning on day 0.
(J) Representative H&E histology with anti-CD3 staining of YUMM1.5 tumor sections collected on day 21. (K) YUMM1.5 tumor volumes following therapeutic treatment with rPSGL-1 Fc beginning on day 14.
(F–J) Experiments were performed 2× with >3 mice/group per experiment.
See also Figure S7.
