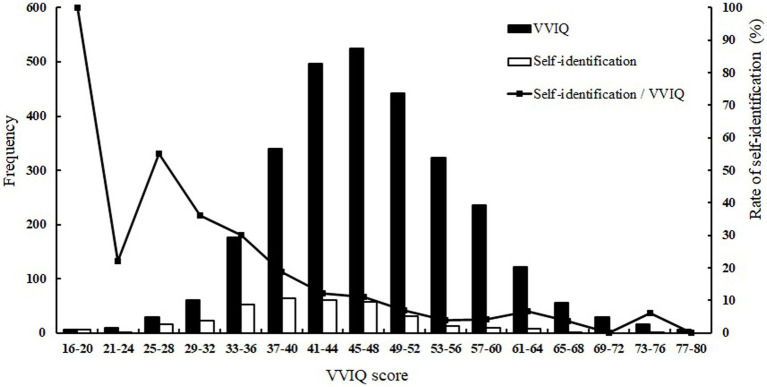
Figure 1.
Frequencies and proportions of VVIQ and self-identification of the reduction in visual imagery. The black bar graph illustrates the frequencies for each VVIQ score (n = 2,871), the white bar graph illustrates the frequencies of self-identification (n = 301) in each VVIQ score, and the line graph shows the rate of self-identification for each VVIQ class.

