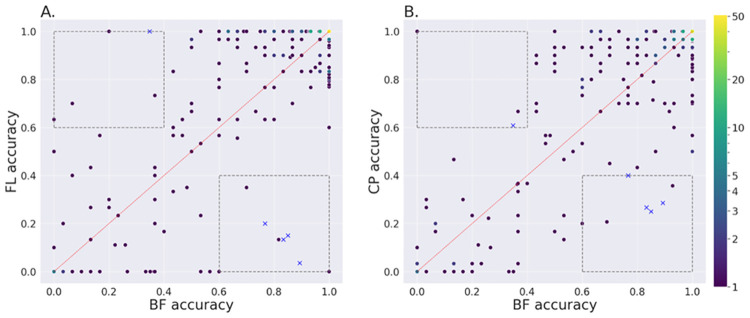
Fig 2. Compound-level accuracy for DMSO normalized input.
Comparison of the accuracy at the compound level, across all five test sets, for the BF models with respect to FL models, and CP feature-based models. The input data was normalized based on the DMSO on each plate for all three cases. Each dark dot represents a compound. Brighter dots represent multiple compounds with the same accuracy score. A. BF against FL; B. BF against CP. In the boxes at the bottom right and top left, thresholded at accuracy values of 0.6 and 0.4, the compounds shown with blue crosses were consistently better for BF than both FL and CP or consistently worse, respectively.

