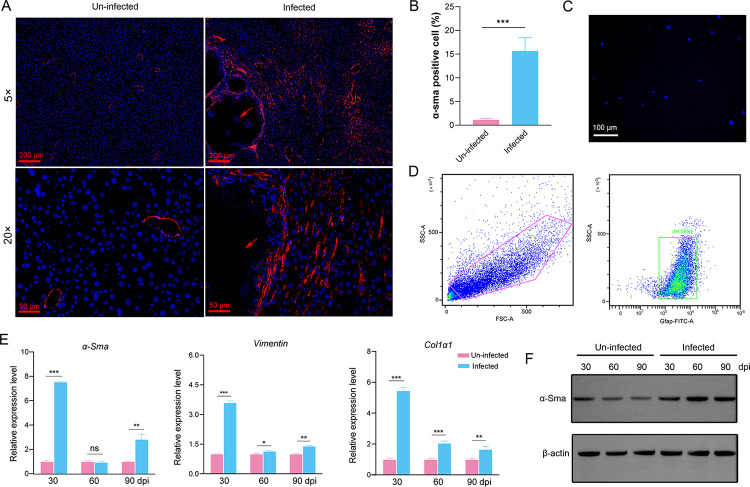
Fig 2. The activation of HSCs induced by E. multilocularis infection.
(A) Representative pictures of immunofluorescence staining for α-SMA in the livers of E. multilocularis-infected and uninfected mice. Arrows indicate cysts. (B) Quantification of α-SMA-positive cells in the livers of E. multilocularis-infected and uninfected mice. (C) Vitamin A lipid droplet autofluorescence in isolated primary HSCs was detected at a wavelength of 328 nm using a fluorescence microscope. (D) Flow cytometry analysis of isolated mouse HSCs using Gfap. (E) The expression of α-sma, col1α1, and vimentin in the HSCs from E. multilocularis-infected mice 30-, 60-, and 90-day post-infection (dpi) by qRT-PCR. (F) The expression of α-SMA in the HSCs from E. multilocularis-infected mice 30-, 60-, and 90-day post-infection (dpi) by Western blotting. Data for final statistical analysis were taken from 3 independent experiments. *p <0.05, **p < 0.01, ***p < 0.001.

