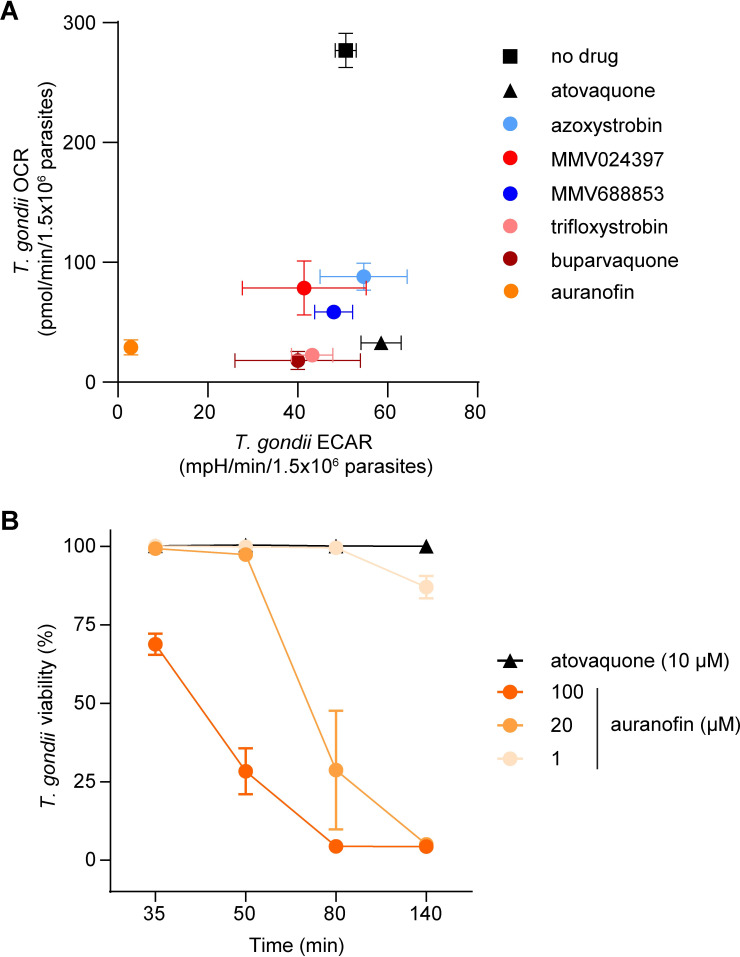
Fig 3. Identification of selective and off-target inhibitors of the ETC in T. gondii parasites.
(A) O2 consumption rate (OCR) versus extracellular acidification rate (ECAR) of T. gondii parasites treated with either no drug (black square), atovaquone (black triangle; 10 μM), azoxystrobin (light blue; 80 μM), MMV024397 (red; 20 μM), MMV688853 (dark blue; 20 μM), trifloxystrobin (pink; 10 μM), buparvaquone (burgundy; 20 μM) or auranofin (orange; 80 μM) assessed using a Seahorse XFe96 flux analyzer. Data represent the mean OCR and ECAR ± SEM of three independent experiments, and are derived from the top concentration of inhibitor tested in S3 Fig. Statistical analyses of these data are presented in S4 Fig. (B) Viability of extracellular T. gondii parasites treated with atovaquone (black triangles, 10 μM) or auranofin (orange circles, 1–100 μM) for 35–140 minutes. Viability was assessed by flow cytometry of propidium iodide-stained parasites and normalized to a DMSO-treated vehicle control, with the gating strategy outlined in S5 Fig. Data represent the mean ± SEM of three independent experiments; error bars that are not visible are smaller than the symbol.

