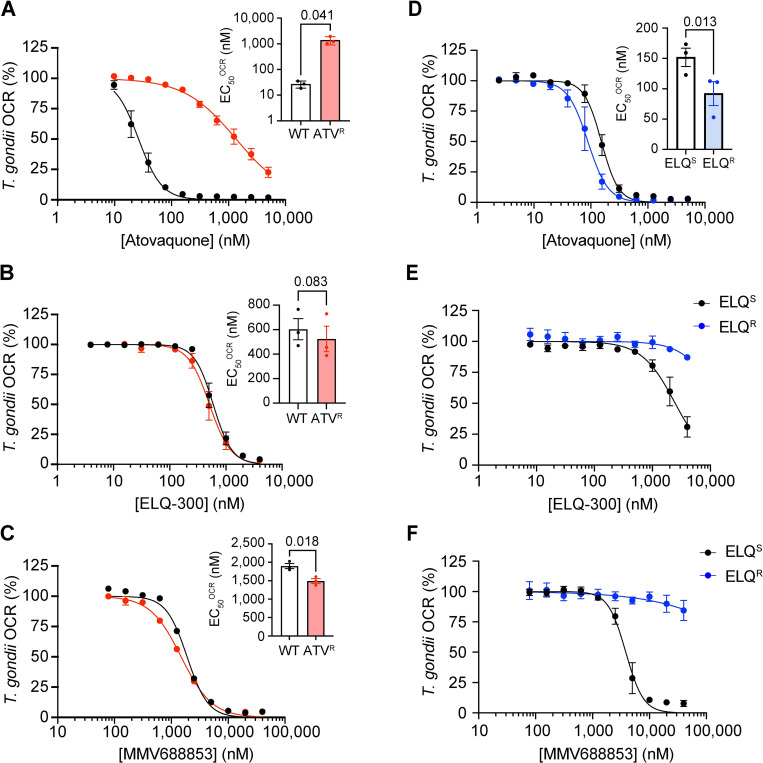
Fig 10. ELQ-300-resistant parasites exhibit cross-resistance to MMV688853 in O2 consumption rate activity assays.
(A-C) Dose-response curves depicting the OCR of intact WT (black) or atovaquone-resistant (ATVR, red) T. gondii parasites in the presence of increasing concentrations of (A) atovaquone, (B) ELQ-300 or (C) MMV688853. (D-F) Dose-response curves depicting the OCR of intact parental ELQ-300 sensitive (ELQS; black) or ELQ-300-resistant (ELQR, blue) T. gondii parasites in the presence of increasing concentrations of (D) atovaquone, (E) ELQ-300 or (F) MMV688853. Values represent the percent OCR relative to the no-drug (100% OCR) and inhibitory atovaquone-treated (D-F) or antimycin A-treated (A-D; 0% OCR) controls, and depict the mean ± SEM of three independent experiments, each conducted in at least duplicate; error bars that are not visible are smaller than the symbol. Inset bar graphs depict the EC50OCR ± SEM (nM) of three independent experiments. Where relevant, paired t-tests were performed and p-values are shown.

