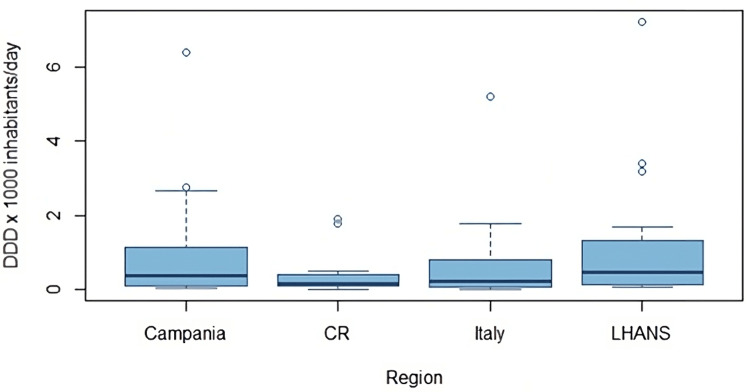
Figure 1. Comparative consumption distribution average across regions in Italy and Costa Rica.
DDD: Defined Daily Dose, CR: Costa Rica, LHANS: Local Health Authority of Naples 3 South *In these plots, most of the data is located within the boxes, the lines represent data that deviates from the average for that region, and the dots represent extreme values. In this case, they represent active components with very high DDDs compared to the others.

