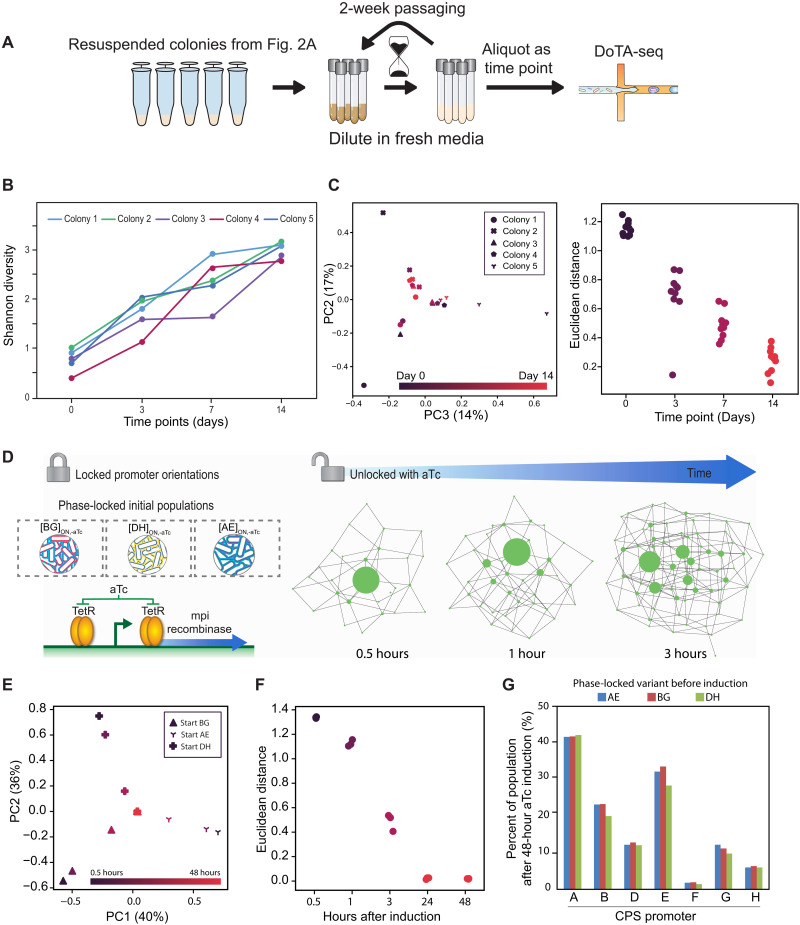
Fig. 3. Population-level promoter-state composition converges to a single steady-state composition over time.
(A) Cartoon schematic of the experiment. The five colonies characterized in Fig. 2 were grown in liquid medium for 14 days and diluted periodically to prevent the culture from reaching late stationary phase. Samples were taken and promoter states were characterized using high-throughput single-cell sequencing at multiple time points. (B) Line plot of Shannon diversities of the five wild-type populations originating from individual colonies over time. Shannon diversity increases with time for all colonies. Day 0 represents the populations as colonies on a plate. (C) The populations show a converging trajectory over time to a single steady state. Right: Population-level promoter-state compositions are visualized by principal components analysis (PCA). Marker shapes represent different populations. Marker colors represent different time points. Left: The pairwise Euclidean distance between all five populations at each time point. The trend of decreasing Euclidean distance shows a converging trajectory of the populations to a single steady state. (D) Cartoon representation of the induced promoter inversion experiment. The native recombinase gene (mpi) responsible for promoter inversions was driven by a TetR-regulated and aTc-inducible promoter. Inversion is induced in phase-locked variants during log phase by the addition of aTc (100 ng/μl) into the cultures. (E) aTc-induced cultures also show a converging trajectory based on PCA. Marker shapes represent different cultures. Marker colors represent different time points. (F) Pairwise Euclidean distances between the three aTc-induced populations originating from different initial promoter states at different time points after induction. By 24 hours, the three populations converged to the same steady state. (G) Bar plot of the percent of promoter-ON abundances for each promoter of the three initial phase-locked populations at 48 hours after aTc induction.

