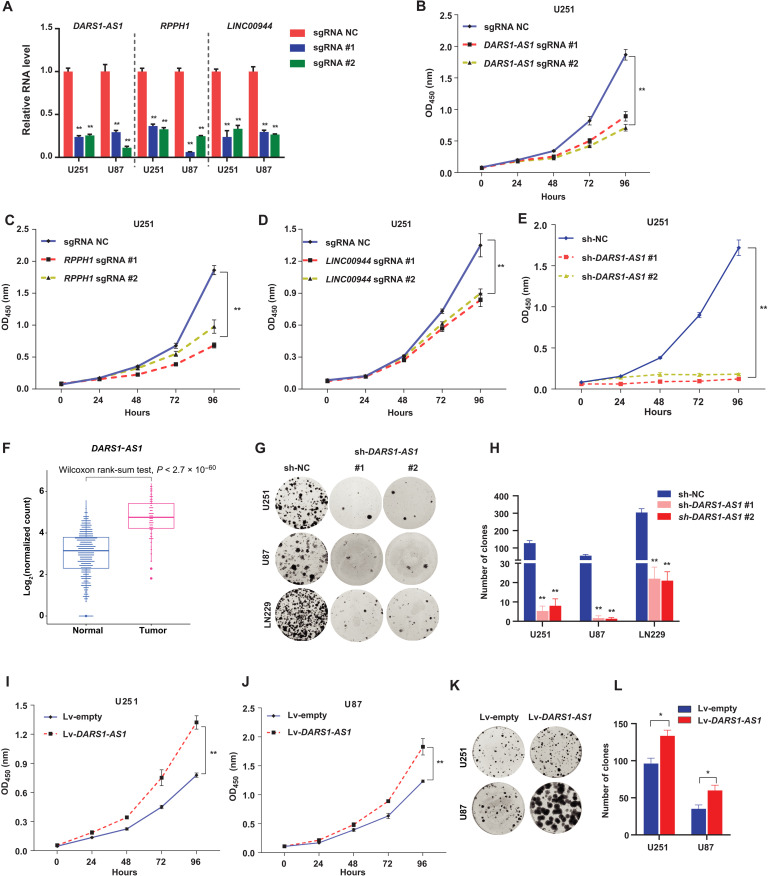
Fig. 2. Validation of the top lncRNA hits in GBM cells.
(A) RT-qPCR analysis of knockdown efficiency for the indicated sgRNAs targeting DARS1-AS1, RPPH1, and LINC00944 compared with the negative control sgRNA (sg-NC) in U251 and U87 with stable expression of dCas9-KRAB fusion protein, where GAPDH was used as an internal control. The growth of U251 cells with stable expression of dCas9-KRAB transduced with sg-NC/sgRNAs targeting (B) DARS1-AS1, (C) RPPH1, or (D) LINC00944 was monitored (OD450 absorbance for WST-8 formazan) every 24 hours with CCK-8 assay for 96 hours. (E) Growth of the U251 cells transduced with the negative control shRNA (sh-NC)/DARS1-AS1–targeting shRNAs was measured with CCK-8 assay for the indicated time intervals. (F) Boxplots showing DARS1-AS1 expression in GBM tumors and normal brain tissues based on TCGA and GTEx RNA-seq data. The statistical significance of difference was assessed by Wilcoxon rank sum test. (G) Representative pictures of clonogenic growth and (H) the bar graph quantifying the colonies formed by U251, U87, and LN229 cells transduced with sh-NC or shRNAs targeting DARS1-AS1, after cells were cultured for 2 weeks. The growth of (I) U251 and (J) U87 cells transduced with an empty lentiviral lincXpress vector (Materials and Methods) control (Lv-empty) or DARS1-AS1 overexpression lincXpress vector (Lv-DARS1-AS1) was monitored every 24 hours with CCK-8 assay for 96 hours. (K) Representative pictures of clonogenic growth and (L) the bar graph quantifying the colonies formed by U251 or U87 cells transduced with Lv-empty or Lv-DARS1-AS1, after cells were cultured for 2 weeks. Data in (A) to (E) and (H) are shown as mean ± SD (n = 3). **P < 0.01 by one-way ANOVA with Dunnett’s multiple comparison test. Data in (I), (J), and (L) are shown as mean ± SD (n = 3). **P < 0.01 or *P < 0.05 by Student’s t test.

