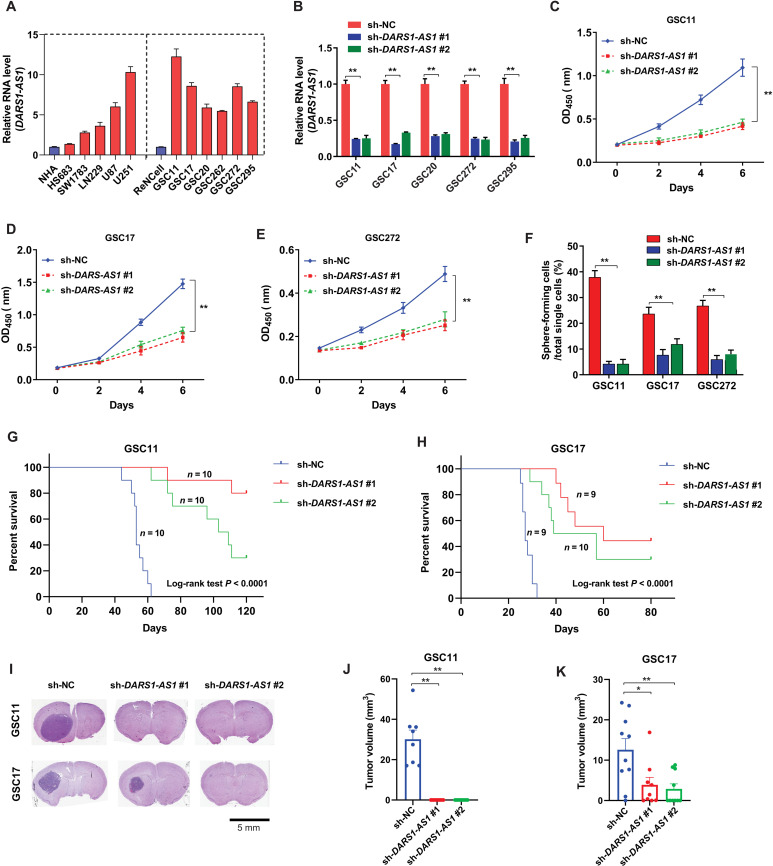
Fig. 3. DARS1-AS1 promotes growth/self-renewal of patient-derived GSCs and orthotopic tumor formation.
(A) RT-qPCR analysis of RNA-level DARS1-AS1 expression in the immortalized NHAs, the LGG cell lines (Hs683 and SW1783), the immortalized human neural progenitor cell line (ReNCell), GBM cells (U87, U251, and LN229), and GSCs (GSC11, GSC17, GSC20, GSC272, and GSC295). (B) The knockdown efficiency of the indicated DARS1-AS1–targeting shRNAs compared with the negative control shRNA (sh-NC) was determined by RT-qPCR in GSC11, GSC17, GSC20, GSC272, and GSC295 cells. The growth of (C) GSC11, (D) GSC17, and (E) GSC272 cells transduced by the negative control shRNA (sh-NC) or individual DARS1-AS1–targeting shRNAs was measured by CCK-8 assays every 2 days for 6 days. (F) Percentages of GSC cells transduced with sh-NC or DARS1-AS1–targeting shRNAs that can form neurospheres from single cells determined by self-renewal assay. The Kaplan-Meier survival curves of the mice (P < 0.0001, log-rank test) with intracranial injection of patient-derived (G) GSC11 and (H) GSC17 cells stably expressing sh-NC (10 GSC11 mice, 9 GSC17 mice, blue), sh-DARS1-AS1 #1 (10 GSC11 mice, 9 GSC17 mice, red), and sh-DARS1-AS1 #2 (10 GSC11 mice, 10 GSC17 mice, green). (I) Thirty (or 21) days after GSC11 (or GSC17) cells stably expressing sh-NC or sh-DARS1-AS1 #1/sh-DARS1-AS1#2 were intracranially grafted into athymic nude mice, the mouse brains were harvested, fixed, embedded, and stained by H&E. Representative images of H&E-stained tumor section are shown. Scale bar, 5 mm. Tumor volumes were calculated as indicated in Materials and Methods for (J) GSC11 and (K) GSC17 cells expressing sh-NC (8 GSC11 mice, 10 GSC17 mice, blue), sh-DARS1-AS1 #1 (10 GSC11 mice, 9 GSC17 mice, red) or sh-DARS1-AS1 #2 (10 GSC11 mice, 10 GSC17 mice, green). Data are shown as mean ± SD. **P < 0.01 or *P < 0.05 by one-way ANOVA with Dunnett’s multiple comparison test. Data in (B) to (F) are shown as mean ± SD (n = 3). **P < 0.01 by one-way ANOVA with Dunnett’s multiple comparison test.

