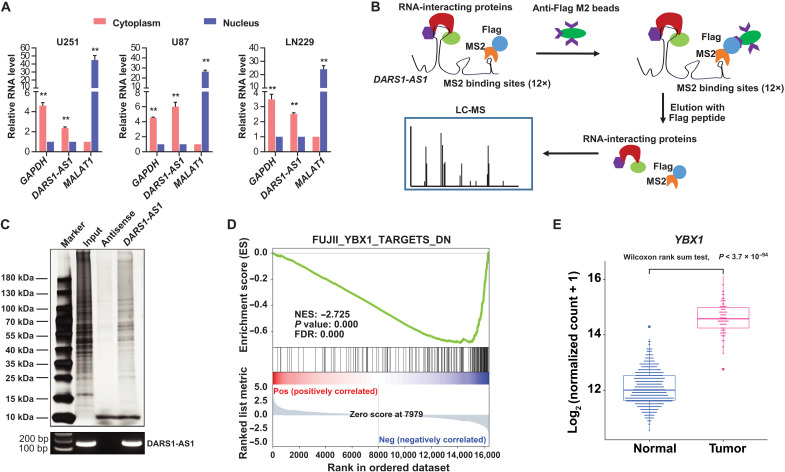
Fig. 4. Integrative analysis of AP-MS and RNA-seq data identifies YBX1 as a DARS1-AS1–associated protein with overlapping downstream targets.
(A) The RNA level of DARS1-AS1 in the nuclear and cytoplasmic fraction of U251 cells was measured by RT-qPCR. MALAT1 RNA and GAPDH mRNA were used as positive controls for nuclear and cytoplasmic fraction, respectively. (B) Schematic diagram showing the workflow identifying DARS1-AS1–associated proteins with MS2bs-tagged RNA affinity purification, coupled with MS analysis. The DARS1-AS1/protein complex was immunoprecipitated with anti-FLAG antibody in the formaldehyde–cross-linked GBM cells stably expressing MS2bs-tagged DARS1-AS1 and FLAG-tagged MS2 proteins, followed by the MS analysis of the eluted proteins. (C) The proteins were retrieved by the pull-down of MS2bs-tagged DARS1-AS1 RNA, and the negative control antisense RNA was visualized by silver staining and subjected to MS analysis. The RNAs retrieved by the RNA pull-down experiments were detected with semiquantitative RT-PCR. (D) GSEA analysis of the RNA-seq data generated with siRNA-mediated DARS1-AS1 knockdown revealed enrichment of a YBX1–down-regulated gene signature. NES, normalized enrichment score. (E) Boxplots showing the expression of YBX1 in GBM tumors and normal brain tissues based on TCGA and GTEx RNA-seq data. The statistical significance of the expression difference between GBM tumors and normal brain tissues was assessed by Wilcoxon rank sum test.

