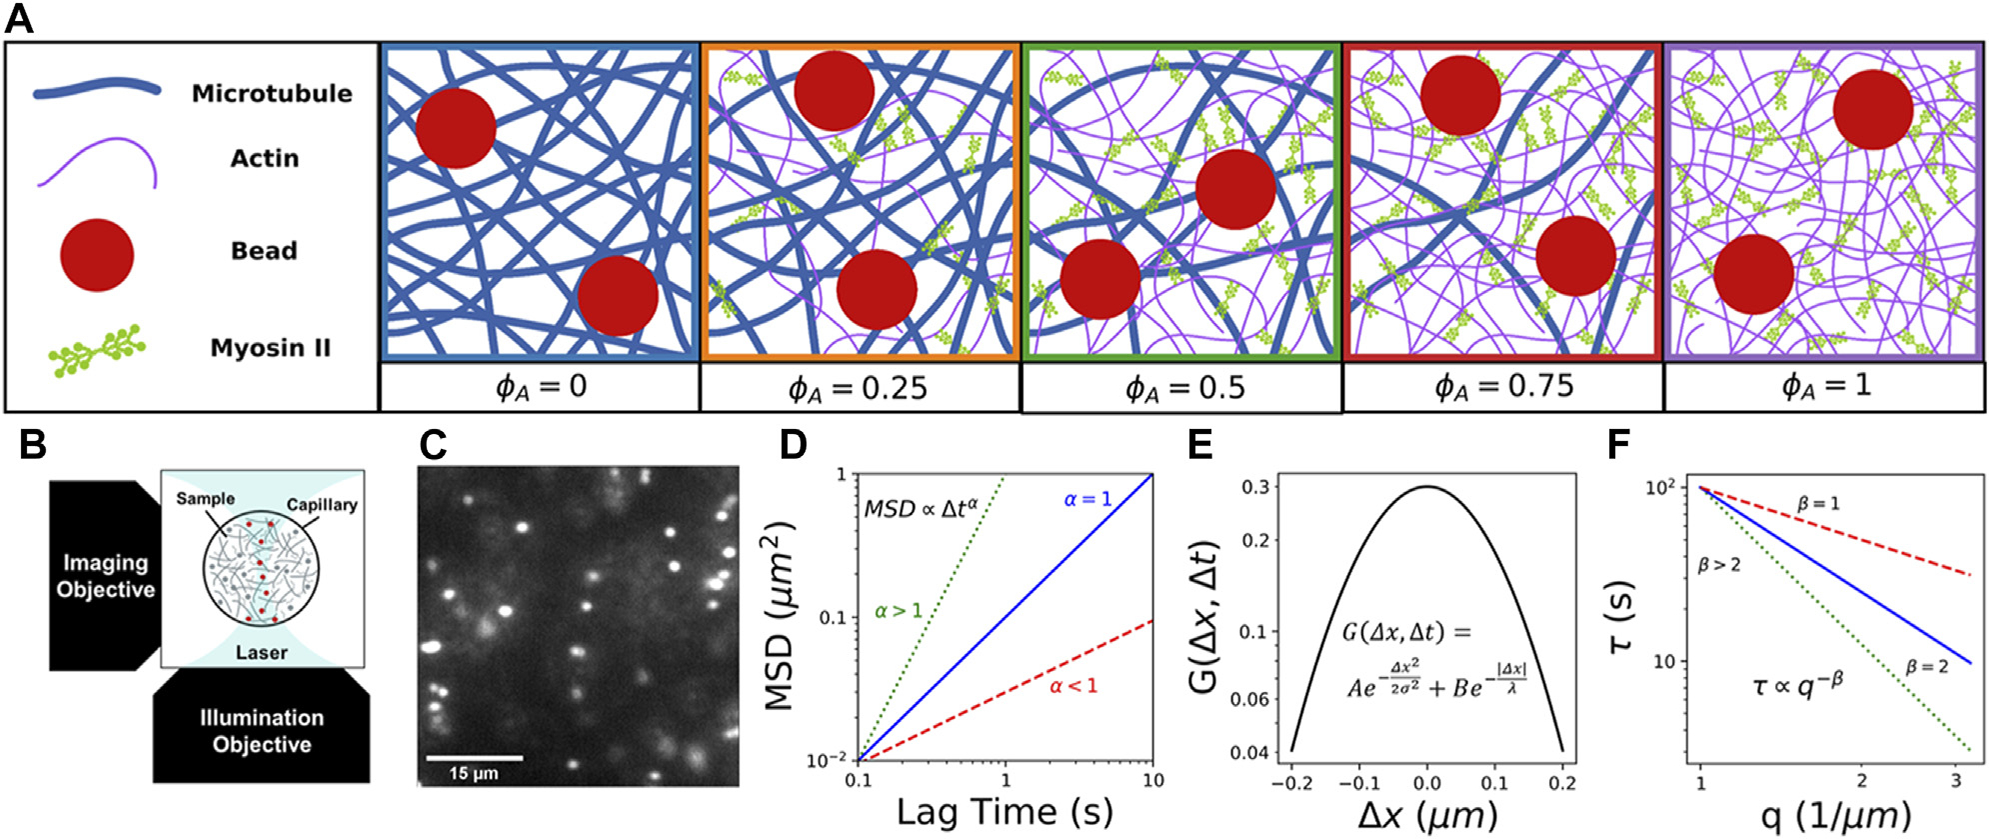
FIGURE 1.

Combining light sheet microscopy with real-space single-particle tracking (SPT) and reciprocal-space differential dynamic microscopy (DDM) to characterize particle transport in active cytoskeletal composites. (A) We create composites of co-entangled microtubules (blue) and actin filaments (purple) driven out-of-equilibrium by myosin II minifilaments (green). We track the motion of embedded 1 μm beads (red) in composites with varying molar fractions of actomyosin, which we denote by the fraction of actin comprising the combined molar concentration of actin and tubulin . In all cases, the molar ratio of myosin to actin is fixed at 0.08. (B) Schematic of the light-sheet microscope we use for data collection, which provides the necessary optical sectioning to capture dynamics in dense three-dimensional samples. (C) Example frame from time-series of beads embedded in a cytoskeleton composite, used to characterize particle transport in active crowded systems. (D) Cartoon of expected mean-squared displacements of embedded particles versus lag time , which we compute via single-particle tracking (SPT) and fit to a power law to determine the extent to which particles exhibit nomal Brownian diffusion (, blue). subdiffusion (, red), or superdiffusion (, green). (E) Cartoon van Hove distribution of - and -direction particle displacements for a given lag time computed from SPT trajectories. The distribution shown is described by a sum of a Gaussian and exponential function , as is often seen in crowded and confined systems and those that display heterogeneous transport. (F) Cartoon of expected characteristic decorrelation times as a function of wave number , which we compute by fitting the image structure function computed from DDM analysis. We determine the scaling exponent from the power-law to determine if transport is diffusive (, blue). subdiffusive (, green), or ballistic (, red).
