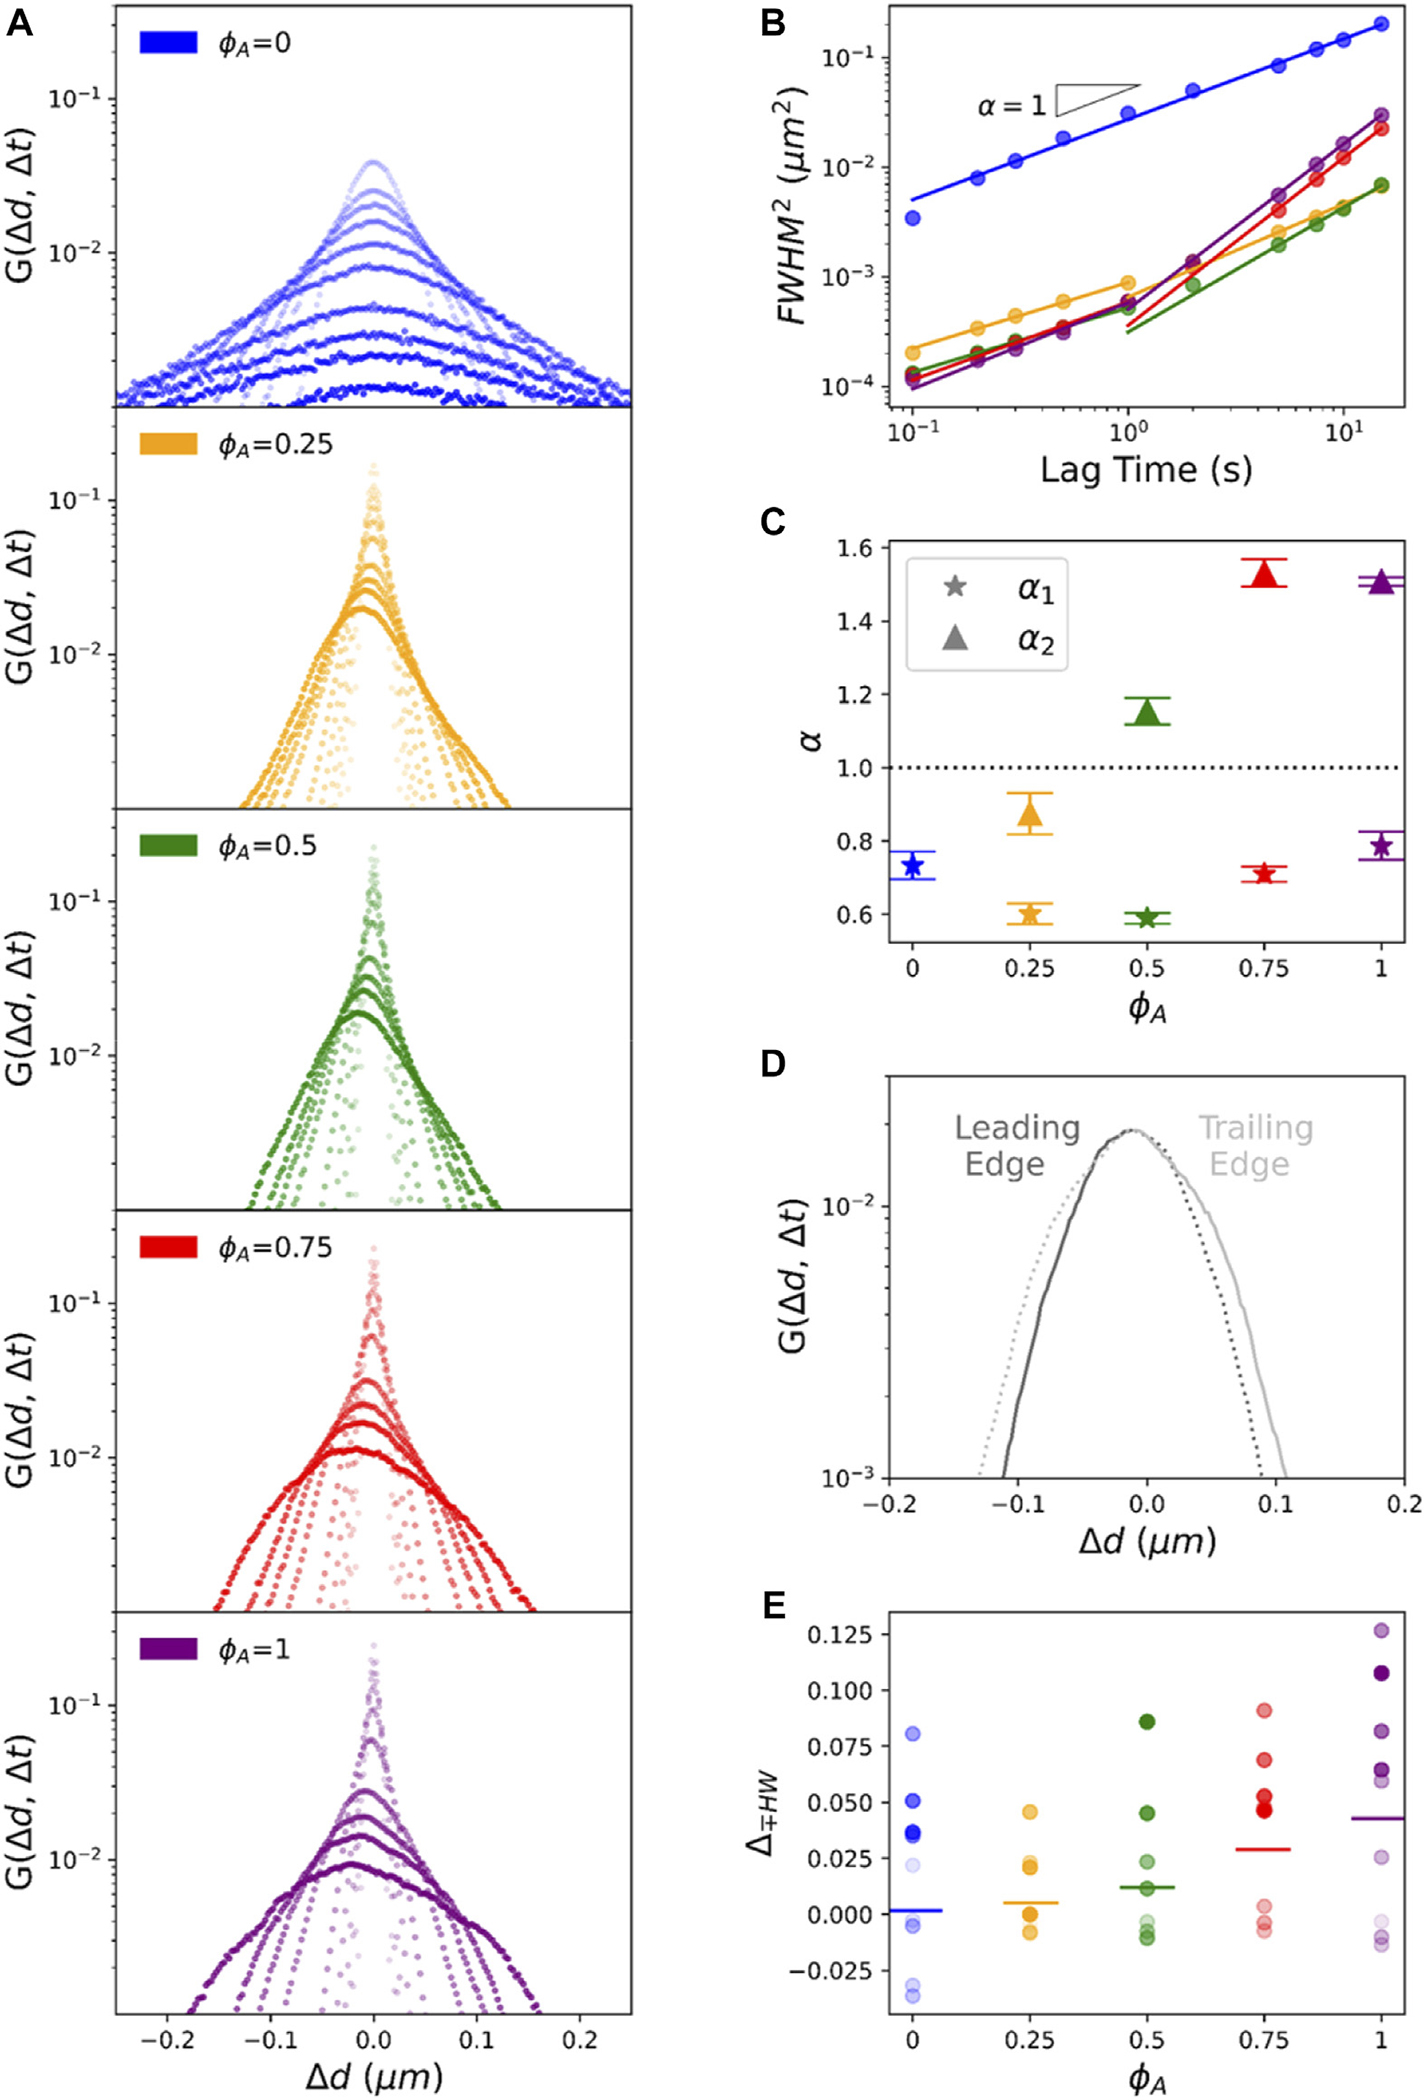
FIGURE 3.

Asymmetric non-Gaussian van Hove distributions reveal a combination of heterogeneous subdiffusion and advective transport of particles in active composites. (A) van Hove distributions of particle displacements , measured via SPT, for lag times denoted by the color gradient going from light to dark for increasing . Each panel corresponds to a different composite demarked by their value with color-coding as in Figure 2. (B) The square of the full width at half-maximum versus lag time for each composite shown in (A). Solid lines are fits to . For composites we fit short and long lag time regimes separately. (C) The scaling exponents as functions of determined from the fits shown in B, where (stars) and (triangles) correspond to scalings for the short and long regimes, respectively. The dashed horizontal line denotes scaling for normal Brownian diffusion. (D) A sample distribution ( at ) showing the asymmetry about the mode value . We divide each distribution into a leading edge (dark grey, displacements of the same sign as and greater in magnitude) and the trailing edge (light grey, the remaining part of the distribution). To clearly demonstrate the asymmetry, we mirror each edge about using dashed lines. (E) The fractional difference of the half-width at half maximum of the trailing (−) edge from the leading (+) edge, for each and . Color coding and gradient indicate and , respectively, as in (A). Horizontal bars through each distribution denote the mean.
