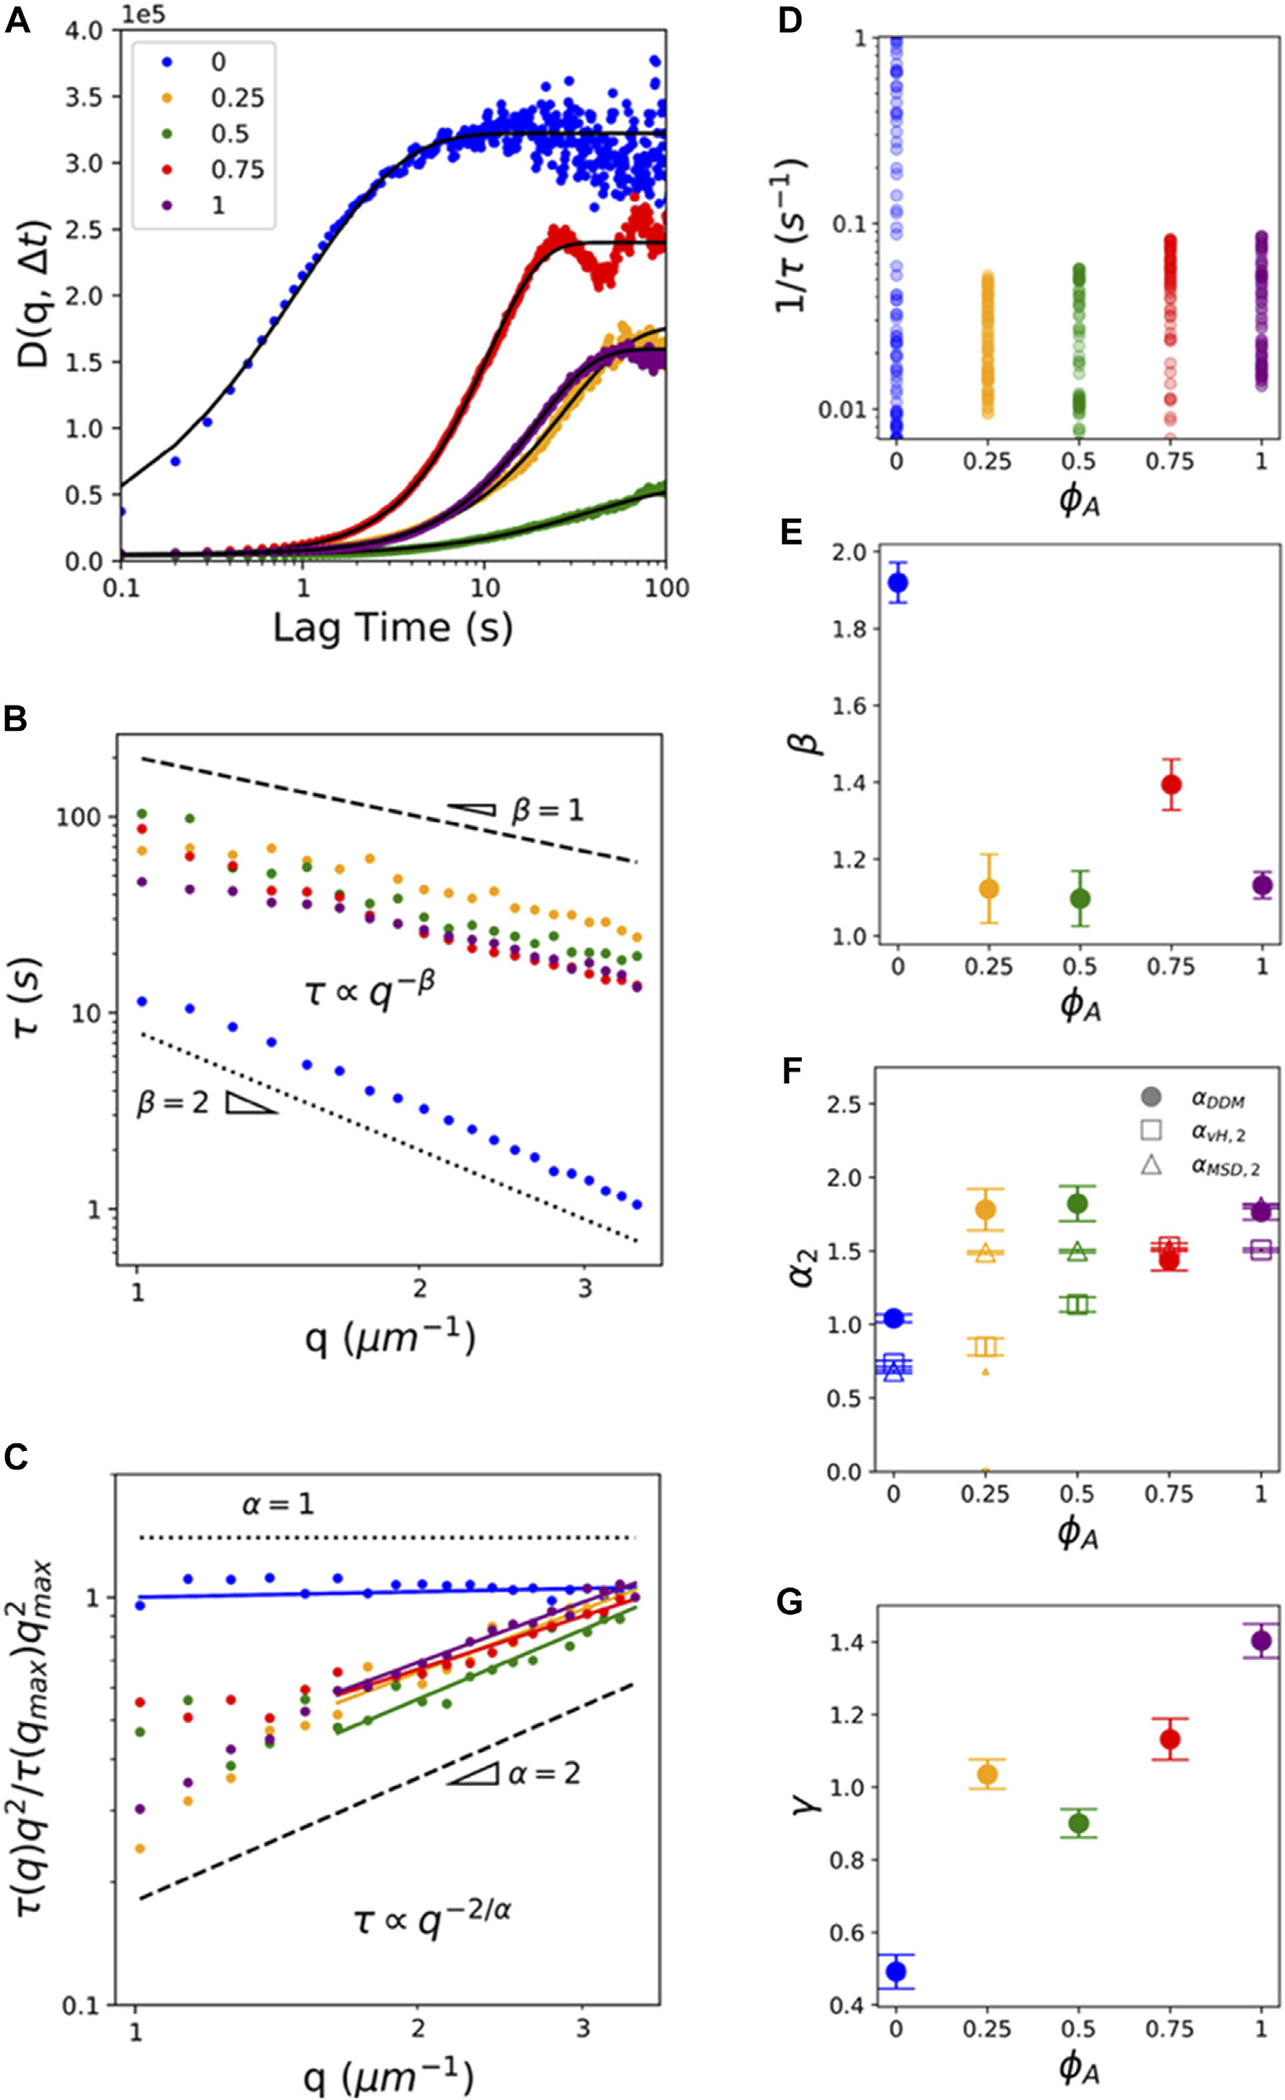
FIGURE 5.

DDM analysis reveals ballistic-like transport of particles entrained in active composites at mesoscopic spatiotemporal scales. (A) Sample image structure functions for composites with actin fractions indicated in the legend. All curves shown are evaluated at , and solid black lines are fits to the data to determine corresponding -dependent decay times and stretching exponents , as described in Methods. (B) Decay times for each composite shown in (A). Dashed and dotted black lines show scaling for ballistic and diffusive transport. (C) , normalized by , for the data shown in (B). Horizontal dotted line and unity-sloped dashed line correspond to scaling indicative of normal diffusion and ballistic motion . Color-coded solid lines correspond to power-law fits, with the corresponding exponents and shown in (E) and (F). For composites, the fitting range is truncated to where a single power-law is observed. (D) Scatter plot of , a measure of the transport rate, for all measured values for each . Color coding and gradient indicate and , respectively, with light to dark shades of each color indicating increasing values. (E) DDM scaling exponents determined from fits shown in (C). (F) Anomalous scaling exponents determined from fits (filled circles, ), as well as the large- regime fits of the (open triangles, ) and van Hove distributions (open triangles, ) measured via SPT (see Figures 2, 3). Error bars indicate 95% confidence intervals of fits. (G) Stretching exponent , averaged over all values, for each composite , with error bars indicating standard error.
