
FIGURE 6.
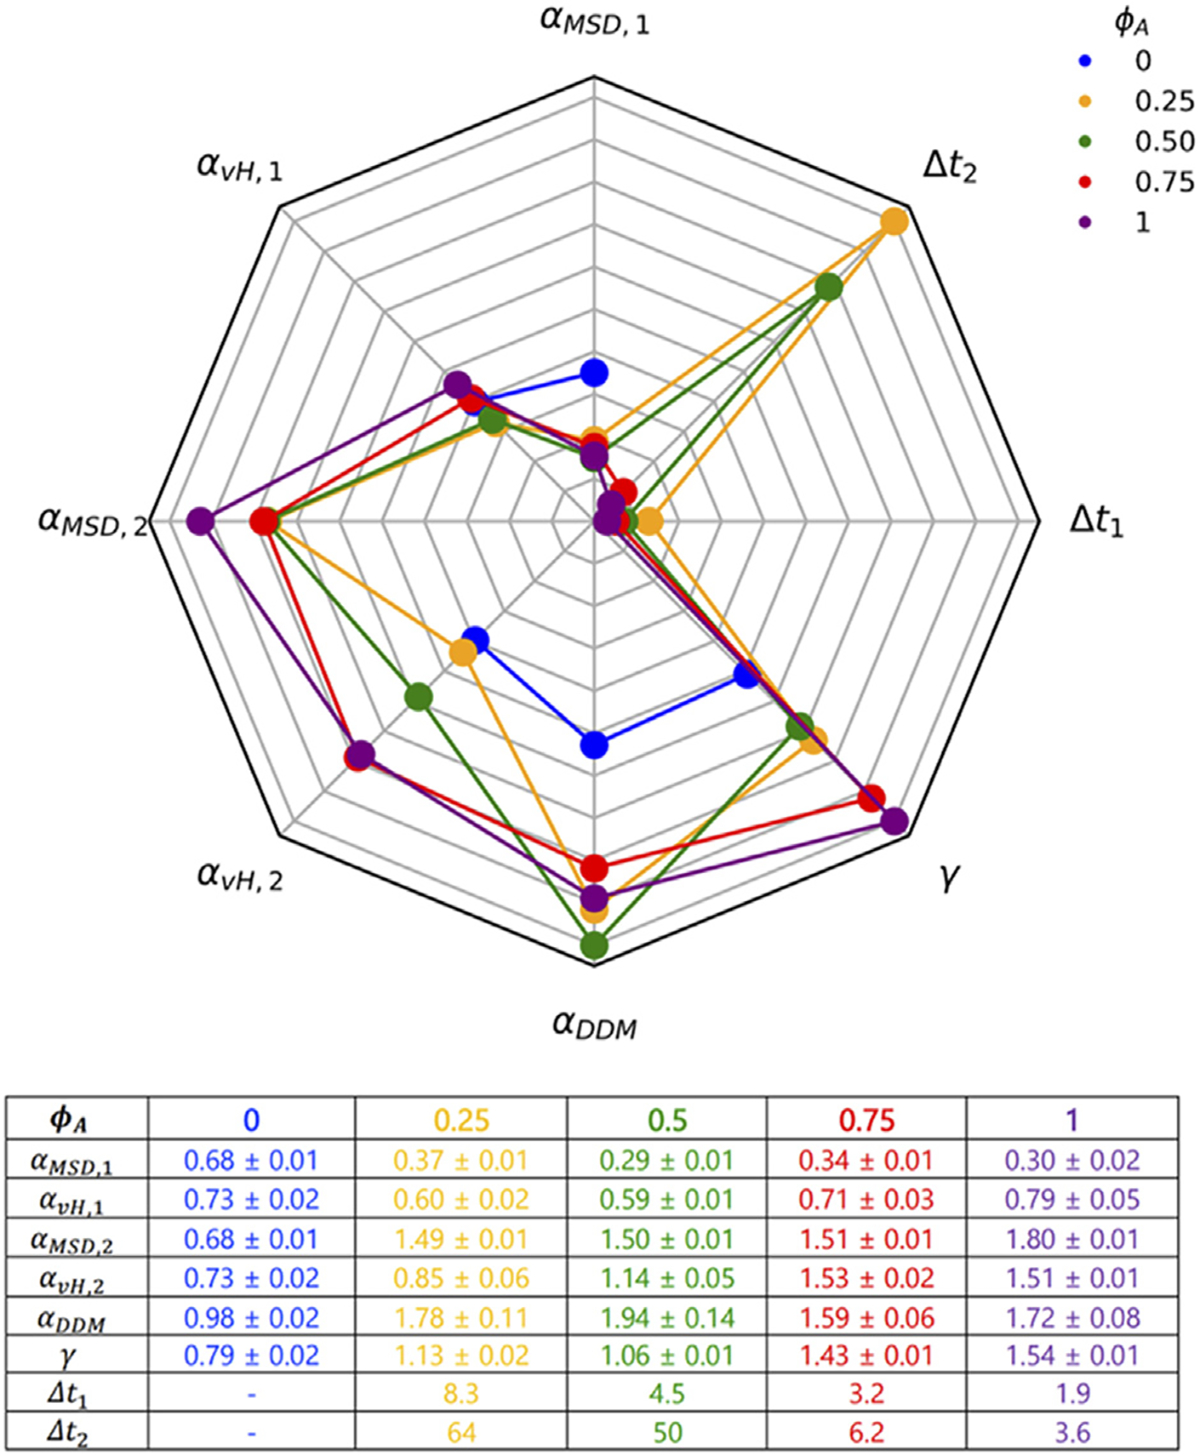
A robust suite of metrics reveals complex scale-dependent transport resulting from competition between motor-driven active dynamics, crowding and network connectivity. The 8-variable spider plot shows how the key metrics we use to characterize transport depend on (color-code shown in legend). A greater distance from the center signifies a larger magnitude. values determined from DDM ), SPT (, , , and SPT van Hove distributions are scaled identically for direct comparison, as are the two timescales determined from s . The stretching exponent is scaled independently. The table provides the values with error for each metric plotted.