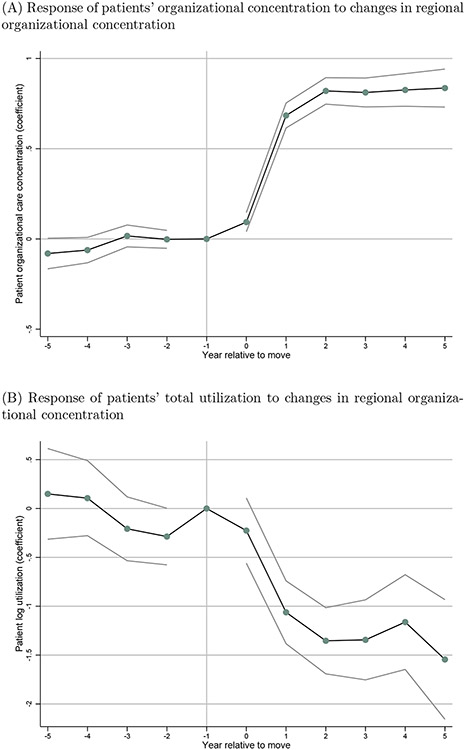
Figure 3: Event study figures for patients who move between regions.
Notes: The two subplots show the estimates and 95% confidence intervals from two separate regressions. The dependent variable in Panel A is patients’ organizational concentration, and in Panel B is log utilization. The figure plots the coefficients on the change in regional organizational concentration interacted with year relative to move. Both regressions control for calendar year fixed effects, and patient fixed effects. Standard errors are clustered at HRR and patient levels.

