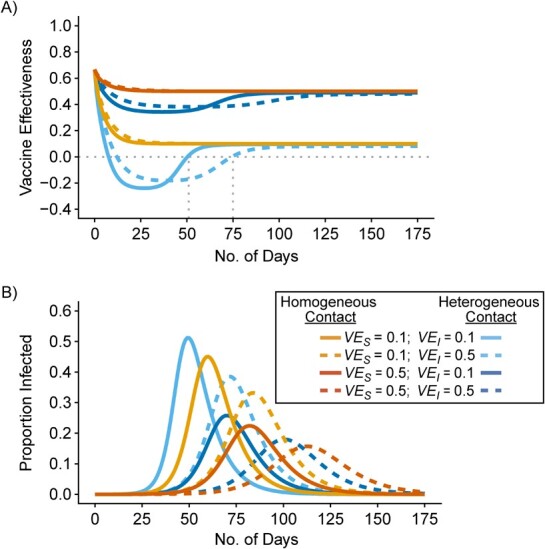
Figure 1.

Simulation results illustrating how vaccine effectiveness (1 – relative risk) and infection dynamics are influenced by contact patterns and vaccine efficacies. Homogeneous contact rates (equal contacts among vaccinated and unvaccinated individuals) and heterogeneous contact rates (vaccinated have higher contact between vaccinated) interact with vaccine efficacy against susceptibility ( ) and vaccine efficacy against infectiousness (
 ) to influence measurements of vaccine effectiveness over time (A) and the proportion of infected (exposed or infectious) individuals over time (B). Measurements of negative vaccine effectiveness became positive once the proportion of susceptible unvaccinated individuals became lower than the proportion of susceptible vaccinated individuals combined with the level of
  (gray vertical lines; Web Appendix 3). Note that here the heterogeneous contact scenarios assume 50% higher contact between vaccinated individuals compared with the homogenous contact scenarios.
