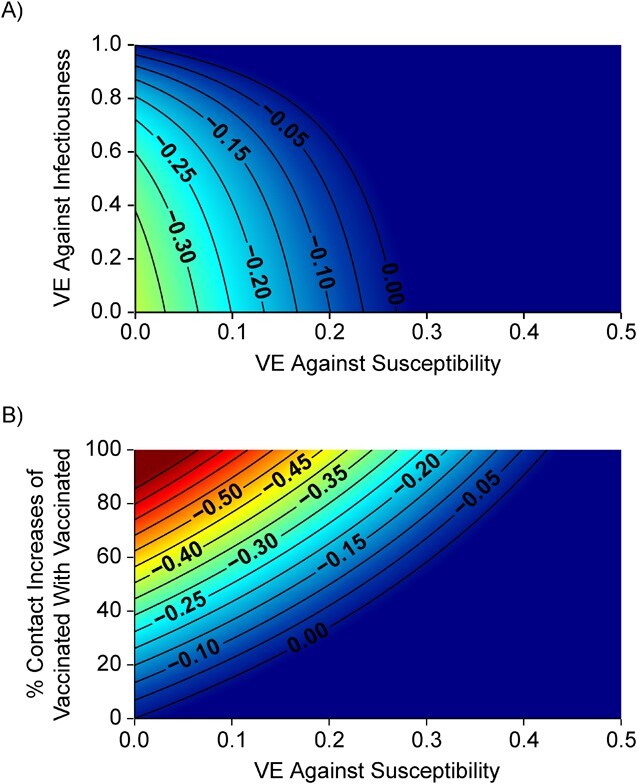
Figure 2.

Simulation results illustrating the sensitivity of negative vaccine effectiveness ( ) measurements to vaccine efficacy (VE) against infectiousness (
 ), vaccine efficacy against susceptibility (
 ), and the degree of higher contact between vaccinated individuals. The existence and degree of observed negative
  , measured using the relative risk, was influenced by
  (A), the % increase in contact between vaccinated individuals (i.e., vaccinated-contact heterogeneity bias) (B), and
  (A and B). Colors indicate the maximum negative
  measurement (the minimum
  ) observed for a given simulation with >0 indicating a nonnegative measurement. Similar patterns also emerge when measuring the effect of
  ,
,  , and the vaccinated-contact heterogeneity bias on
  underestimates (Web Figure 5).
