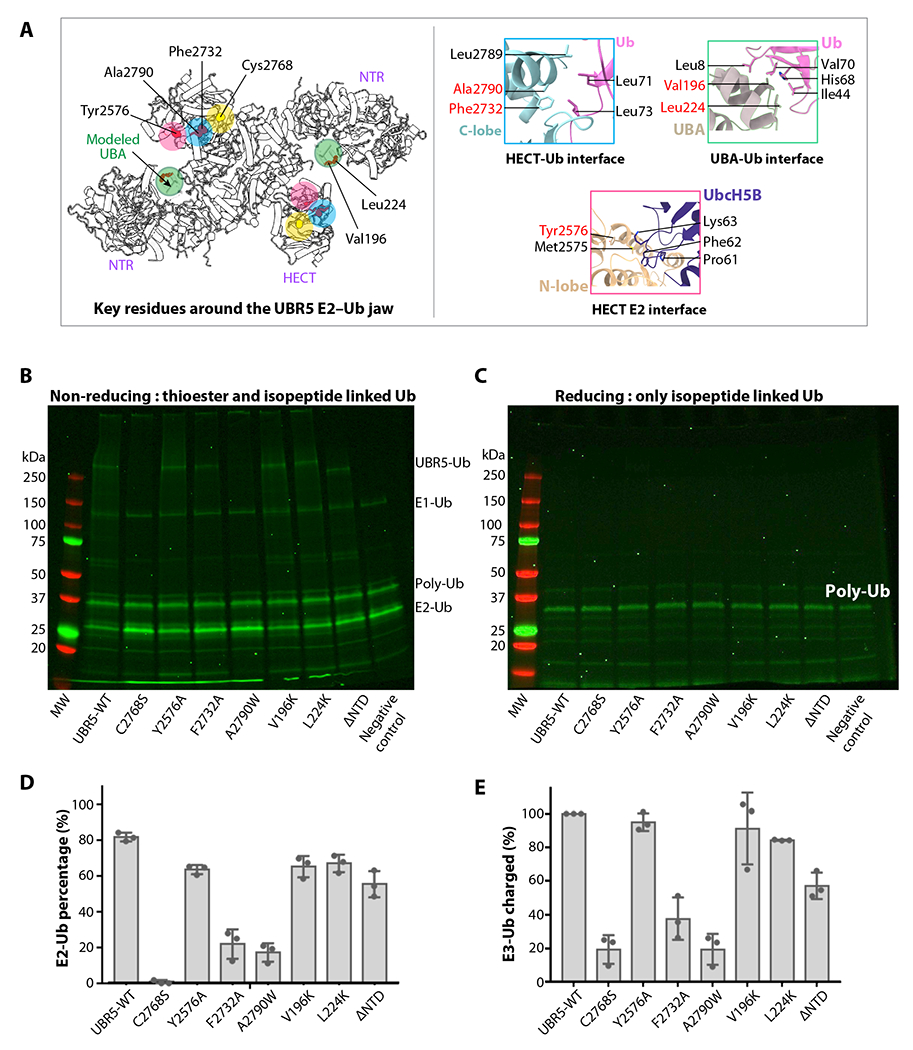
Figure 6. Ub transfer assay from E2-Ub to UBR5 by WT and mutations around the E2–Ub jaw.

(A) Key residues involved in E2 and Ub binding are displayed as red spheres, and their locations are highlighted by colored circles. The catalytic cysteine is in yellow. The right panels show the catalytic pocket and three predicted interfaces between HECT C-lobe and Ub, between HECT N-lobe and Ub, and between UBA and Ub, based on alignment with the isolated HECT–Ub structures shown in Figure 5A. The UBA location is based on the published isolated UBR5 UBA–Ub complex structure (PDB ID 2QHO). (B-C) In-gel fluorescence of the E2 discharge assay by purified WT and seven mutant UBR5 proteins under non-reducing (B) and reducing agent (5mM β-mercaptoethanol, C). (D) Quantification of the E2-Ub bands. (E) Quantification of the ubiquitylated WT and mutant UBR5 proteins. In panels d-e, ΔNTR refers to UBR5 truncating N-terminal residues 1-875. All values represent means ± SD obtained from three independent experiments.
