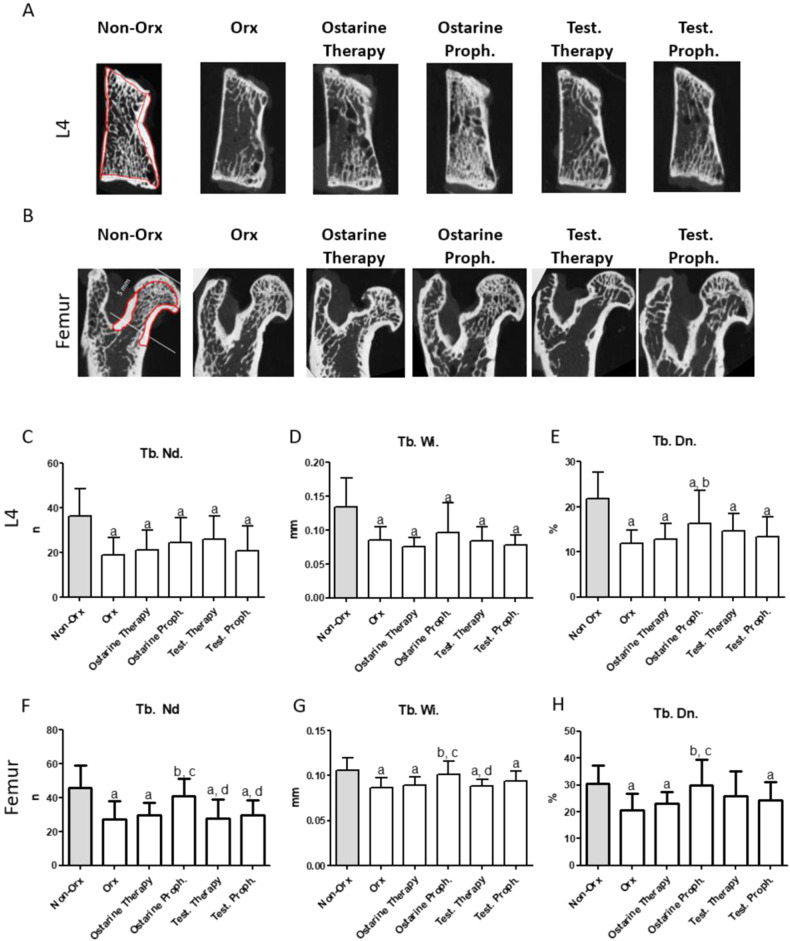
Fig. 3.
Representative 2D images of L4 and the femur (A, B). The measurements areas of cortical and trabecular bone in femur and L4 are surrounded by red lines for the Non-Orx groups. 2D analysis of L4 (C–E) and femur (F–H) performed 18 weeks after Orx in Non Orx rats and Orx rats either untreated or treated with ostarine or testosterone. a: differs from Non Orx; b: differs from Orx; c: differs from Ostarine Therapy group; d:differs from Ostarine Proph. Group, (p < 0.05, Tukey–test)

