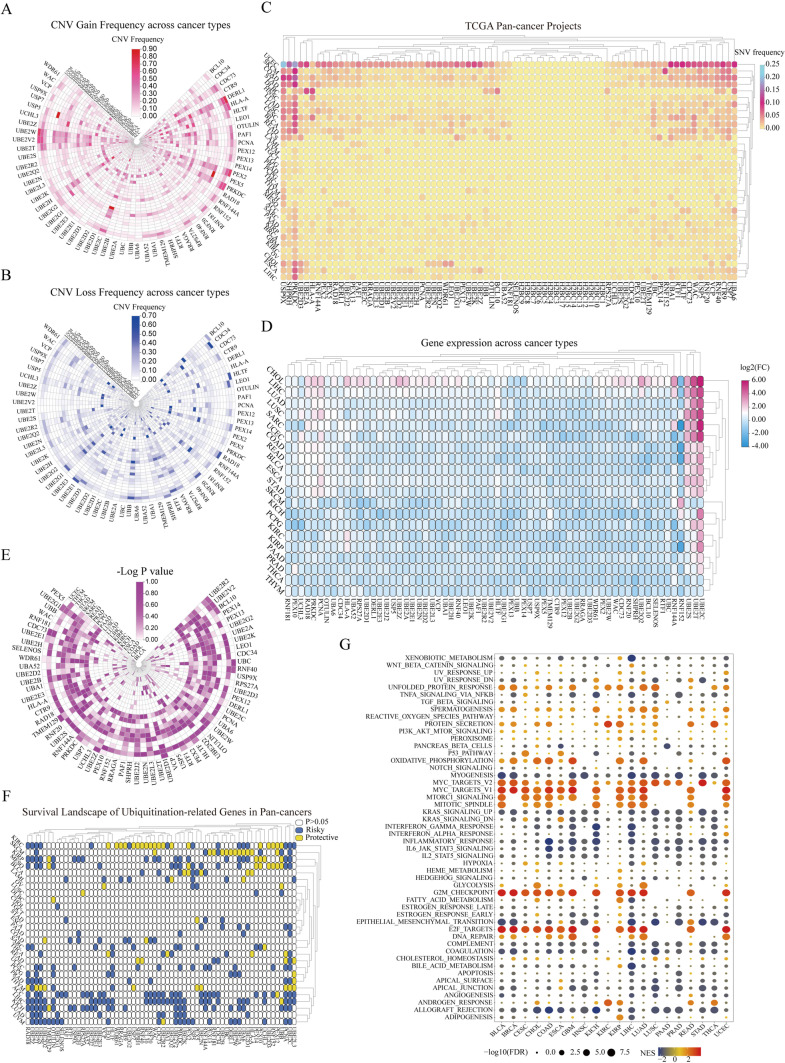
Fig. 1.
Pan-cancer overview of the ubiquitination-related genes. A, B CNV gain frequency and CNV loss frequency information among cancer types. The red color represents the gain frequency, whereas the blue color represents the loss frequency in the ubiquitination-related genes from pan-cancers. C SNV data among cancer types. The mutant frequencies of ubiquitination-associated genes in pan-cancers (red color to blue color represents low to high). D, E Differential expression traits of the ubiquitination-related genes in pan-cancers and their corresponding para-cancerous tissues (D log2FC values, E p values). F Prognostic contributions of the ubiquitination-related genes in pan-cancers. Genes (p > 0.05) were presented by white color, and the risky and protective genes were presented by blue and yellow colors, respectively. G Enrichment analysis for typical cancer-associated pathways between distinct URG-score crowds (NES, normalized enrichment score)

