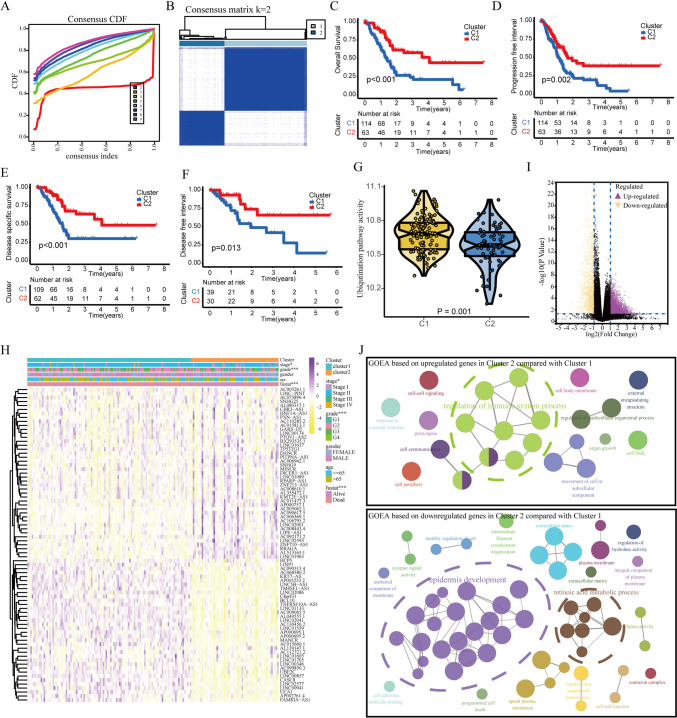
Fig. 4.
Identification of ubiquitination-related clusters in PAAD using consensus clustering analysis. A The consensus CDF curve when k is between 2 and 9. B The correlation between two ubiquitination-related clusters when k value is 2. C–F Comparison of OS, PFI, DSS, and DFI between two ubiquitination-related clusters. G Relationship of ubiquitination pathway activities and ubiquitination-related clusters. H Heatmap shows the correlation between ubiquitination-related clusters and clinicopathologic traits. I Volcano plot displayed 2689 upregulated and 1656 downregulated genes in cluster 2 compared with cluster 1. J GOEA was generated based on 2689 upregulated and 1656 downregulated genes with the Cytoscape plug-in ClueGO, CluePedia, and yFiles Layout Algorithms. The different colors of node represented the different GO results of 2689 upregulated and 1656 downregulated genes. The size of the node represented p value, and the p values of all nodes are < 0.05

