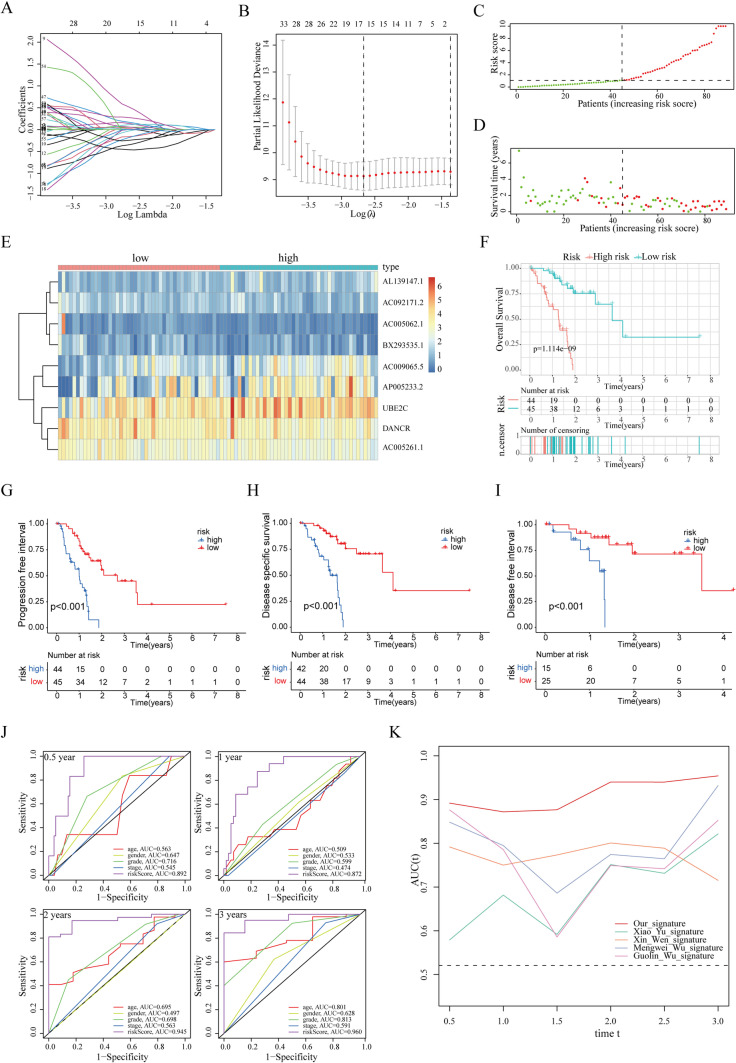
Fig. 6.
Construction and assessment of ubiquitination-related prognostic signature based on the train cohort. A, B The processing of LASSO algorithm. (A the trajectory changes of the independent variables; B the confidence interval of each lambda). C Sectionalization based on the median risk score. D Distribution characteristics of survival status in low-risk and high-risk populations. E Heatmap showed the molecular expression levels of 9 genes involved in the prognostic panel. F–I The discrepancies in clinical outcomes between low-risk and high-risk patients, including OS, PFI, DSS, and DFI. J Multi-index combined with ROC curve highlighted the superiority and great clinical application value of ubiquitination panel. K ROC curves of our URPS and other four prognostic signatures of PAAD

