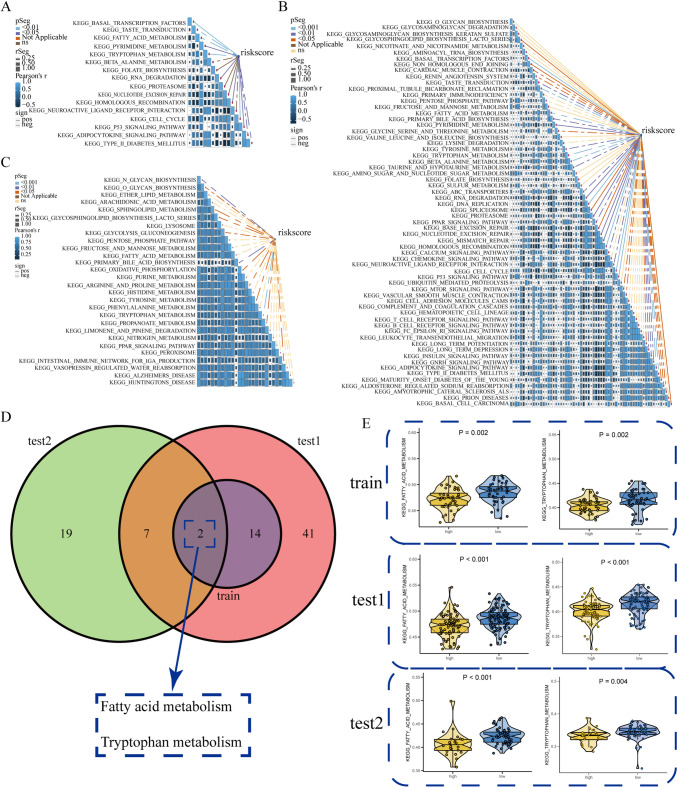
Fig. 8.
The correlation between differential tumor-related pathways and risk score. A–C Pearson correlation analysis showed the correlation between risk score and the enrichment score of tumor-related pathways in the training and test cohorts. D Two pathways screened by the intersection of tumor-related pathways among the training and test cohorts. E The discrepancy of fatty acid and tryptophan metabolism scores computed by ssGSEA in the training and test cohorts (ordinate: metabolism-related pathway scores calculated by ssGSEA. A higher metabolism score indicates a higher metabolism activity)

