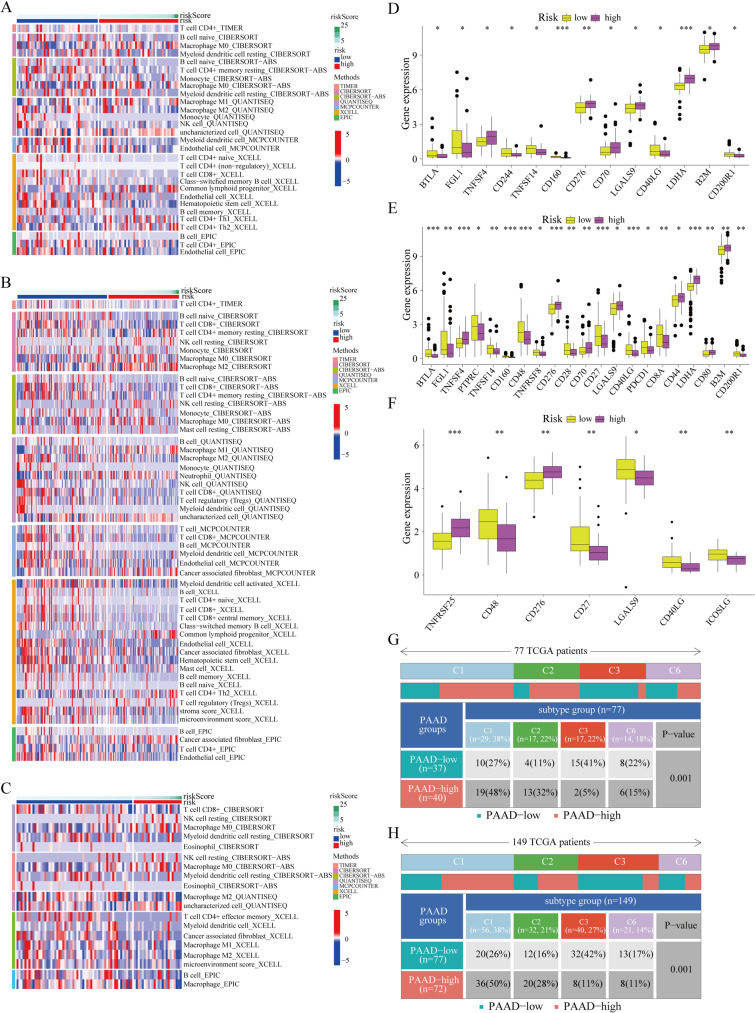
Fig. 9.
The differences of immune characteristics between low-risk and high-risk subgroups. A–C The heatmaps showed immune cell infiltrations in different risk subgroups based on the training and test cohorts. D–F The gene expressions of immune checkpoints in low-risk and high-risk subgroups based on the training and test cohorts. G, H The distributions of immune subtypes in low-risk and high-risk subgroups based on the training and test1 cohorts

