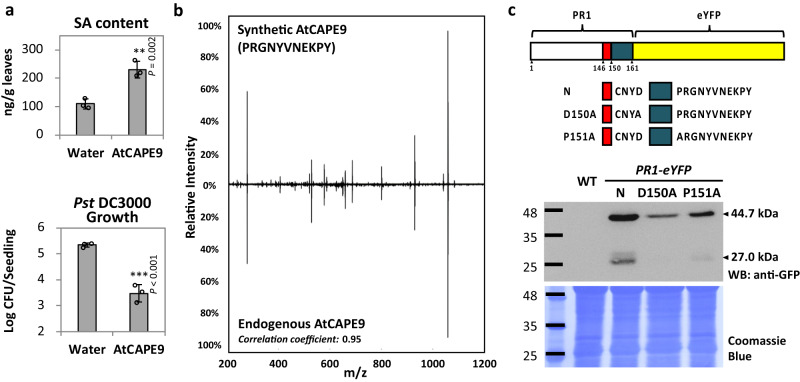
Fig. 1. Bioactivity and endogenous production of AtCAPE9 through proteolysis of PR1 in Arabidopsis.
a The SA contents and the growth of Pst DC3000 in Arabidopsis treated with water or AtCAPE9. The SA concentration in the plants was quantified by LC–MS/MS with spiked deuterium-labeled SA standard. Log colony-forming units (Log CFU) of Pst DC3000 were measured after 7 days of inoculation. Values are means ± SD of three biological replicates. Each replicate was obtained from the pooling of three plants. P values were calculated by one-tailed unpaired t-test (**, P < 0.01; ***, P < 0.001). b MS/MS spectra of the endogenous and synthetic AtCAPE9. The endogenous AtCAPE9 was identified from the SA-treated Arabidopsis leaves. The peak list for each spectrum and the similarity between the spectra were determined by Pearson correlation coefficient calculated in Supplementary Data 1. c Immunoblot of the native or alanine-substituted (N, D150A or P151A) PR1 fused to an enhanced yellow fluorescent protein (eYFP) overexpressed in Arabidopsis. A schema representing three constructs for each transgenic line is illustrated at the top of the panel. The sizes of intact/uncleaved PR1-eYFP (N, D150A and P151A) proteins and the AtCAPE9-eYFP fragment were estimated to be ~44.7 and ~27.0 kDa, respectively, detected by western blotting with anti-GFP antibody. Coomassie Blue staining shows total protein loaded. Experiments were repeated three times with similar results.

