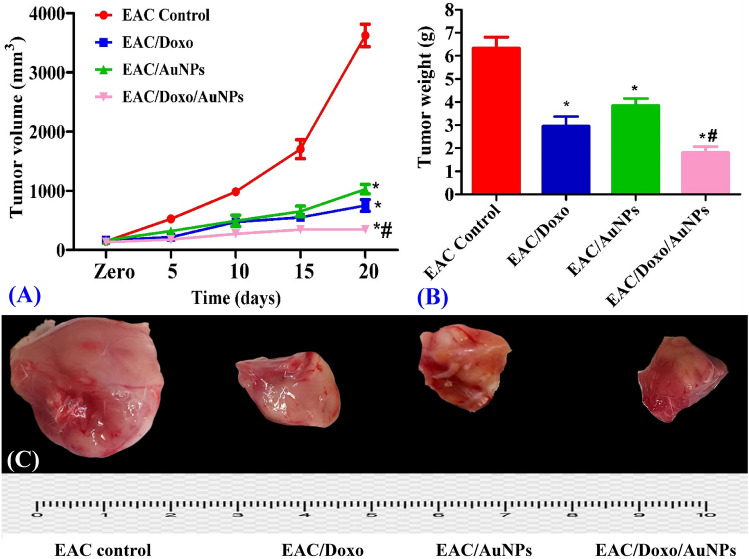
Figure 10.
Effects of AuNPs alone or in combination with Doxo on tumor volume (nm3) (A) and tumor weight (g) (B) of EAC bearing mice. All tumor images (C) were taken at the same magnification power, zooming and distance from camera. Data are expressed as means ± SEM (n = 6 for EAC control group and n = 7 for EAC/Doxo, EAC/AuNPs, and EAC/Doxo/AuNPs groups). Statistical comparisons were made using one way of analysis of variance (ANOVA) followed by Tukey–Kramer post hoc test for multiple comparisons. *Indicates significant difference vs. EAC control at P < 0.05; #represents significant difference vs. EAC/AuNPs at P < 0.05.

