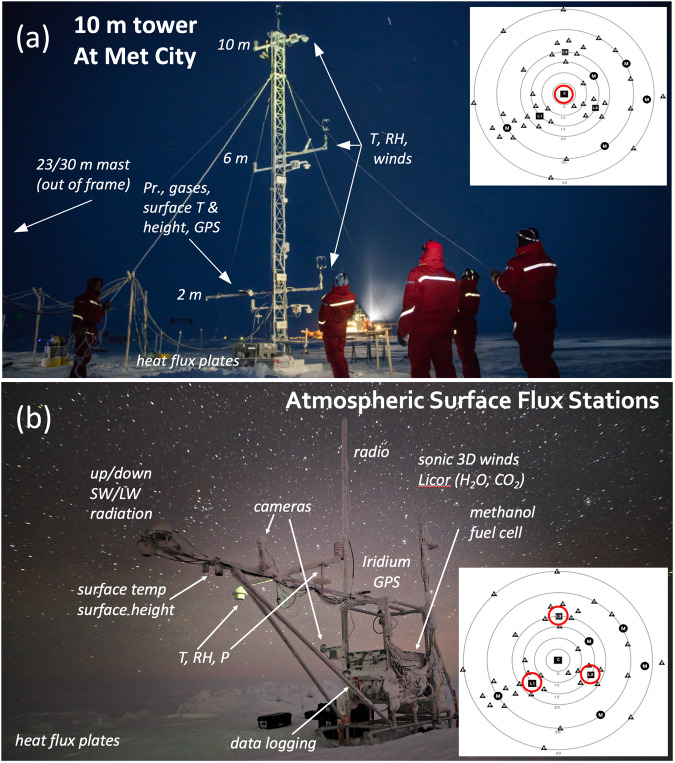
Fig. 2.
(a) Image of the tower at Met City in October 2019 (photo by Esther Horvath). (b) Image of ASFS-50 on 1 January 2020 (photo by Michael Gallagher). Both panels are annotated with instrument locations. The insets are maps from the DN at the beginning of Leg 1 with distances in km from Polarstern (large circles) (credit: Daniel Watkins). The red circles in (a) are the CO where the tower was positioned; the three red circles in (b) are the L-sites (L1 lower-left (ASFS-40), L2 (ASFS-30) lower-right, L3 (ASFS-50) top) where ASFS were deployed in October 2019.

