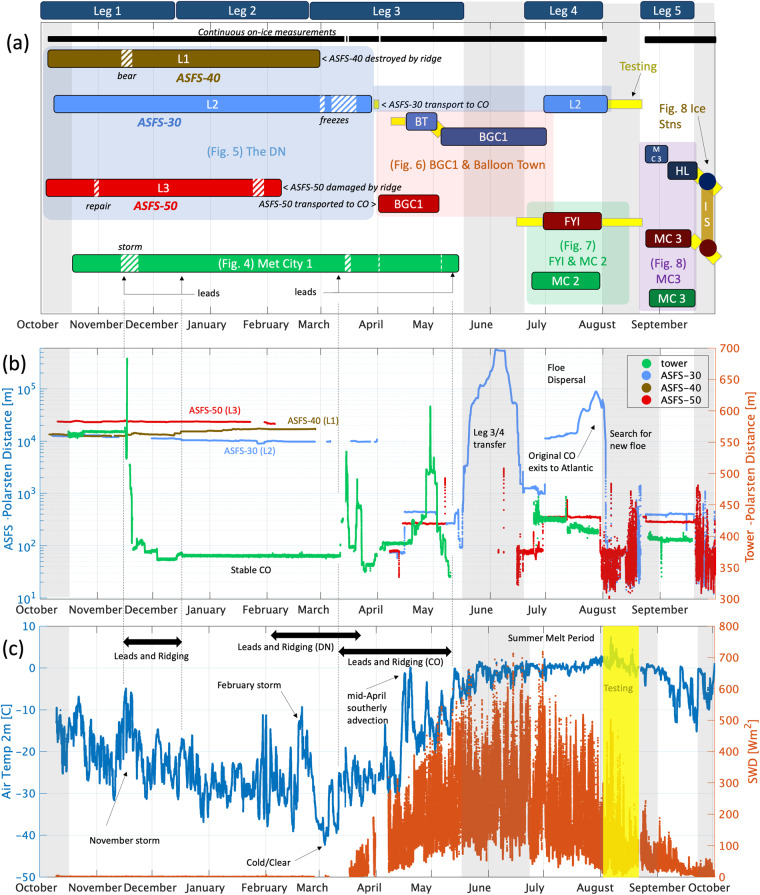
Fig. 3.
(a) Timeline of installations. “Legs” shown along the top refer to the five legs of the expedition; for precise dates, refer to ref. 3. Hatch patterns are missing or intermittent data. The vertical grey bars are periods when Polarstern was underway. The horizontal yellow bars are periods of testing and have data of limited scientific use. The black horizontal bar denotes the periods when data were continuous in the aggregate. In (a), the Figures in parentheses illustrate the setup during these time periods, which are described individually under section Observation context and user of assets. MC is a shorted form of “Met City” and the numbers 2 and 3 denote the second and third deployments of Met City, which were at different locations than the original (see main text). (b) Distances between Polarstern and each ASFS (left axis, log scale) and the tower (right axis, linear scale). (c) Composite (tower/all ASFS) temperature (left axis) and shortwave downwelling radiation (FSD, right axis). The vertical yellow bar marks when Polarstern was underway in search of a new floe and no scientific data were collected from the ice. The data shown during this period is from testing of ASFS-50 carried out on the aft deck of Polarstern: they are not considered scientifically valid and are only shown here for reference.

