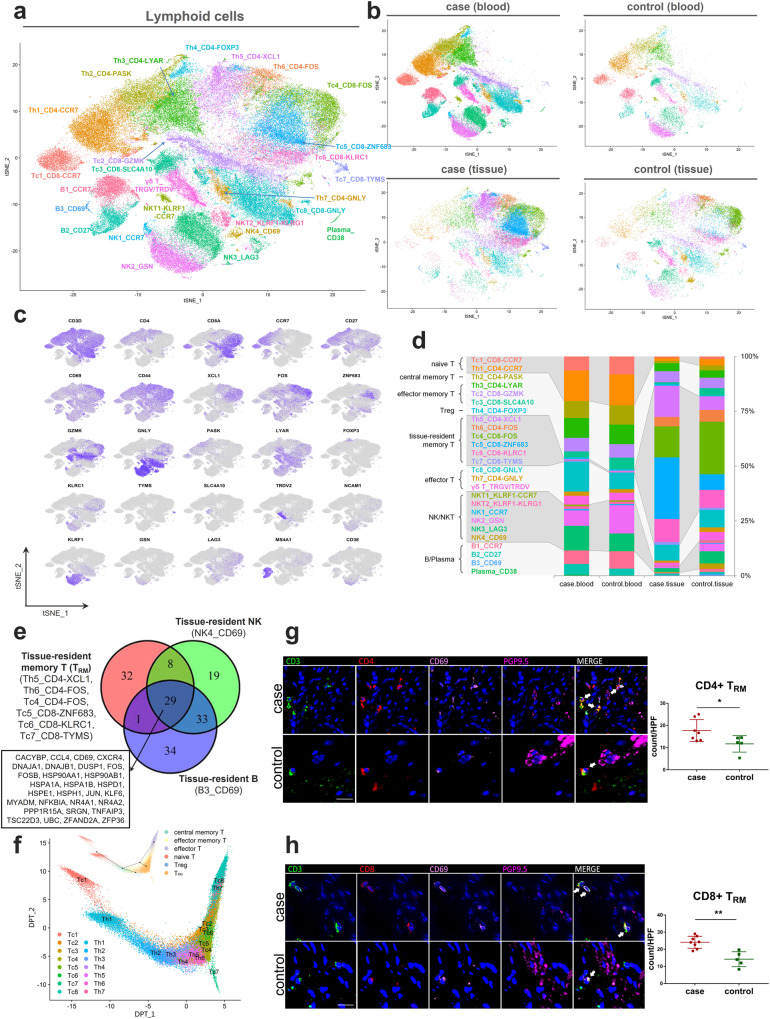
Fig. 4. Single-cell transcriptomics of subclustered lymphocytes.
a, b t-SNE plot of the 26 lymphocyte clusters (a) and detailed lineages in different tissue contexts (b). c t-SNE plots of canonical marker genes for 26 lymphocyte clusters. d Lymphocyte proportions for LES tissue and blood between achalasia and controls, colored by cell types. e Venn diagram showing the core signature shared by TRM and tissue-resident NK and B cells. f Pseudotemporal transcriptional trajectory of the T cells using the DPT and Slingshot algorithms. g, h Multicolor IHC and quantifications of CD4+ TRM (g) and CD8+ TRM (h) in the LES tissue between achalasia (CD4+ TRM, n = 7; CD8+ TRM, n = 8) and controls (n = 5). The TRM were increasingly infiltrated and surrounding the residual sparse myenteric plexus (shown by PGP9.5) in achalasia. Scale bar, 20 μm. Data are represented as mean ± SD. Statistics: two-tailed unpaired t-test. *P < 0.05; **P < 0.01. Arrow, CD4+ and CD8+ TRM. Source data are provided as a Source Data file.

