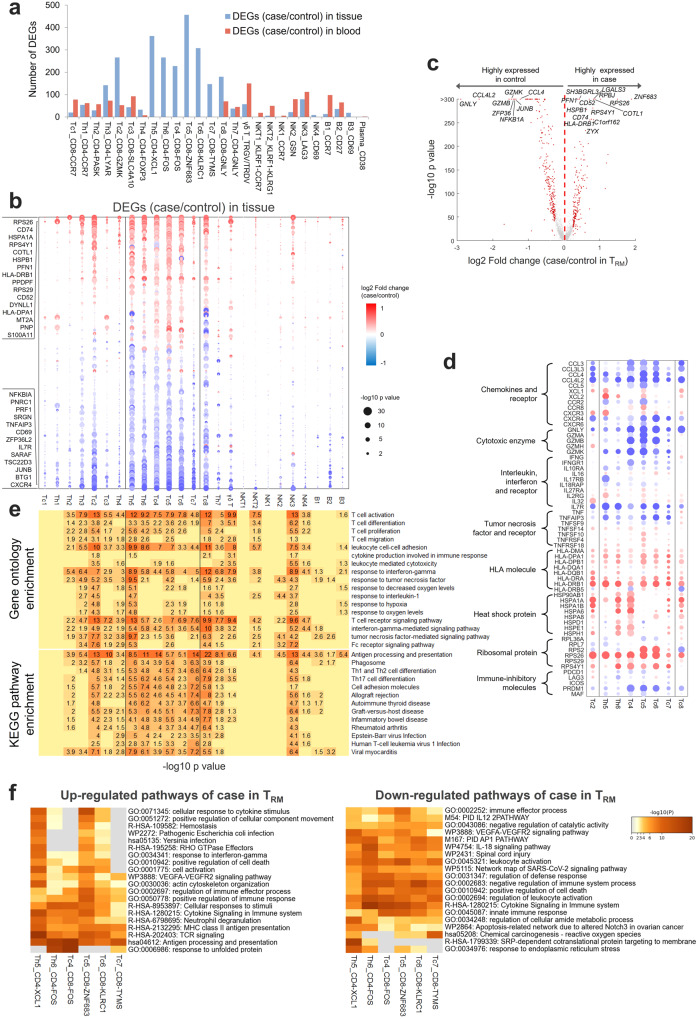
Fig. 5. TRM expressed transcripts involved in dysregulated immune responses in achalasia.
a A bar chart depicting the differentially expressed genes (DEGs) between achalasia and controls for the 26 lymphocyte clusters. b Dot plot of DEGs for the 26 lymphocyte clusters in blood and LES tissue. c Volcano plot showing the merged DEGs for TRM. d Specific DEGs for TRM, GZMK+ CD8+ T cells (Tc2), and GNLY+ CD8+ T cells (Tc8). e GO (up) and KEGG (down) analysis of DEGs for the 26 lymphocyte clusters. f Metascape analysis of DEGs for TRM. Statistics: P-value in (b–d): two-sided Wilcoxon rank-sum test; P-value in (e, f): Fisher’s exact test. Source data are provided as a Source Data file.

