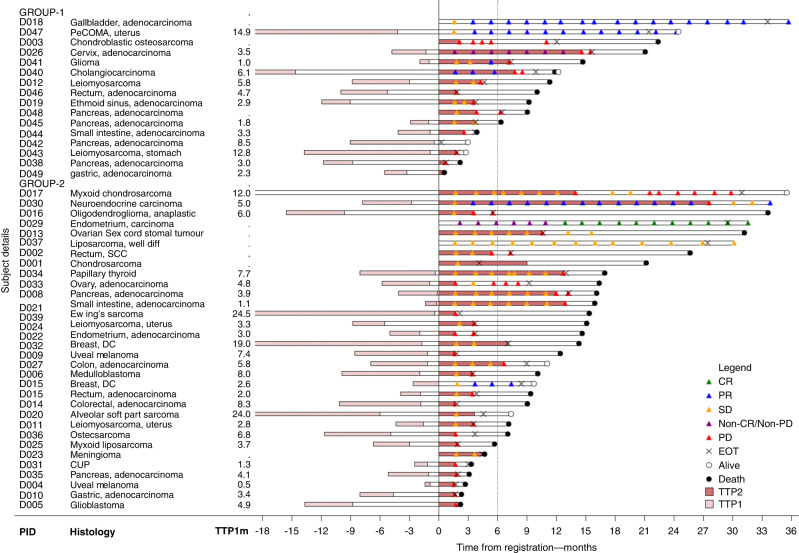
Fig. 2. Swimmer plot characterising secondary trial endpoints by the individual patients within each group.
Group 1: BRCA1/2 alterations and Group 2: other homologous recombination repair alterations. TTP1—time to progression prior to trial, with the bar left of 0 depicting duration of therapy and timing of prior therapy in relation to commencing on trial. PID patient ID, CR complete response, PR partial response, SD stable disease, PD progressive disease, EOT end of treatment, TTP2 time to progression on trial.

