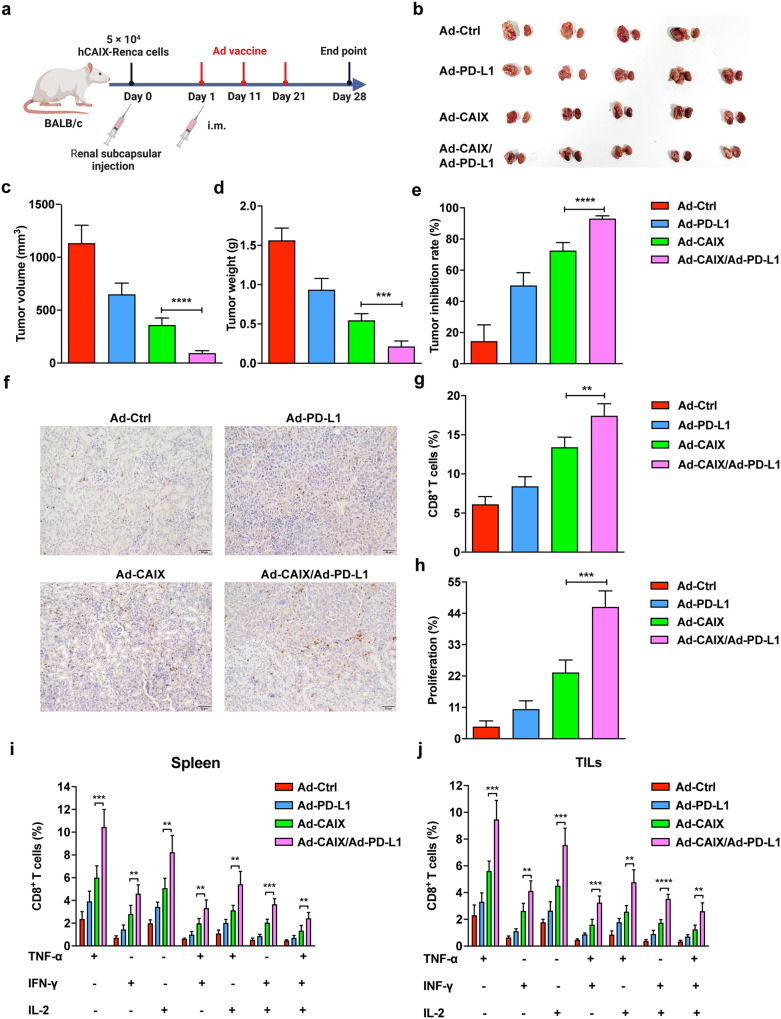
Fig. 6. Therapeutic effects of Ad-CAIX/Ad-PD-L1 in the hCAIX-Renca renal orthotopic model.
a Schematic diagram of the establishment of hCAIX-Renca renal orthotopic model and vaccine immunization. b Representative images of bilateral kidneys of mice in each group at the end of the experiment (unilateral tumor). c Tumor volumes. d Tumor weights. e Statistical analysis of tumor inhibition rate. f Infiltration of CD8+ T cells detected by IHC in renal tumor tissues (scale bar, 50 μm). g Determination of the proportion of infiltrating CD8+ T cells in renal tumors by flow cytometry. h The proliferation of CD8+ T cells was detected by the EdU assay. i, j Proportions of TNF-α+CD8+, IL-2+CD8+, IFN-γ+CD8+, TNF-α+IFN-γ+CD8+, TNF-α+IL-2+CD8+, IFN-γ+IL-2+CD8+ and TNF-α+IFN-γ+IL-2+CD8+ T cell subsets of mice in spleens and TILs from each group. Individual experiments were performed three times, and results from one representative experiment were shown for each group of mice. Data are means ± SD. **p < 0.01, ***p < 0.001, and ****p < 0.0001. Multiple groups of comparison data were analyzed by one-way ANOVA.

