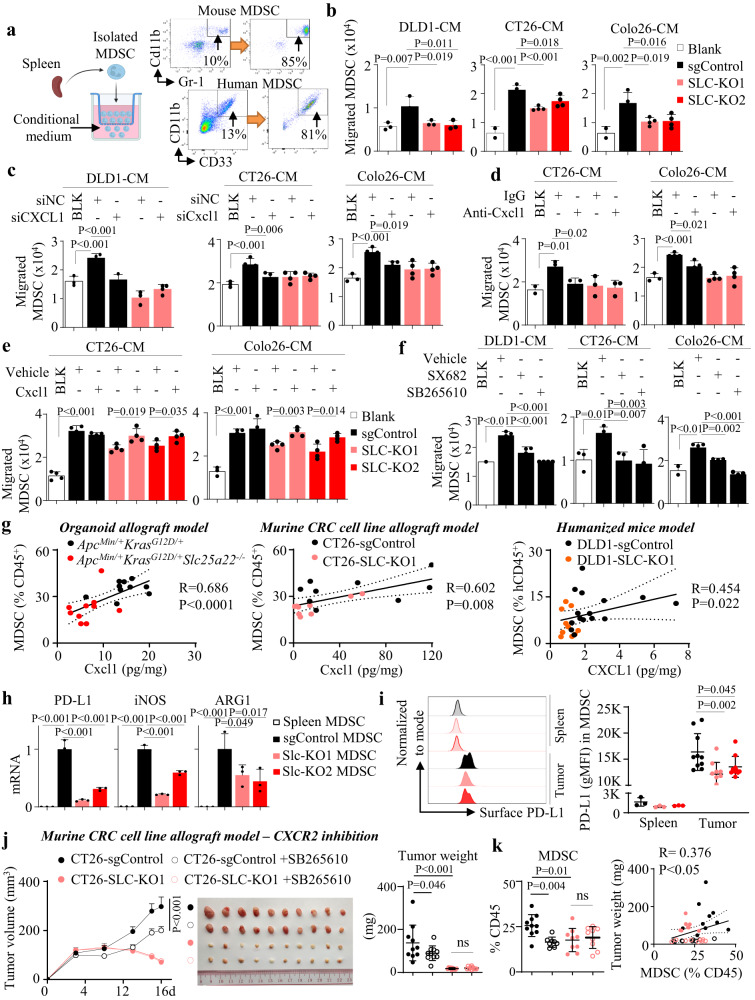
Fig. 4. SLC25A22 knockout abrogates recruitment and activation of MDSC in KRAS-mutant CRC via a CXCL1-CXCR2 axis.
a Flow cytometry validation of isolated mouse MDSC (CD11b+ Gr-1+) and human MDSC (CD11b+CD33+) from the spleens of tumor-implanted syngeneic mice and PBMC humanized mice, respectively. b Conditioned medium from sgControl cells induced MDSC migration, which was impaired by SLC25A22 knockout (n = 4). Each dot represents an independent sample. c siCXCL1, but not siCXCL3, abrogated induction of MDSC migration in sgControl cell conditioned medium (n = 4). Each dot represents an independent sample. d Anti-Cxcl1 neutralizing antibody (0.25 µg/mL) suppressed MDSC migration in sgControl cell conditioned medium; but had no effect on SLC25A22 knockout cells (CT26: n = 3; Colo26: n = 4). Each dot represents an independent sample. e Recombinant Cxcl1 (1 ng/ml) rescued MDSC migration in CT26-Slc-KO and Colo26-Slc-KO conditioned medium (n = 4). Each dot represents an independent sample. f CXCR2 inhibitors SX682 (2 μM) or SB265610 (10 μM) abolished MDSC migration in sgControl cell conditioned medium (n = 4). Each dot represents an independent sample. g Tumoral CXCL1 positively correlated with MDSC infiltration in ApcMin/+KrasG12D/+ organoids (n = 10) in C57BL/6 mice, CT26 allografts (n = 9) in BALB/c mice, and DLD1 xenografts (sgControl, n = 15; SLC-KO1, n = 10) in PBMC humanized mice. Each dot represents an independent mouse. h qPCR of isolated MDSC from CT26 allografts showed that activation markers PD-L1, iNOS, and ARG1 were enhanced in intratumoral MDSC compared to that of splenic MDSC, and was abrogated in SLC25A22 knockout tumors (n = 3). Each dot represents an independent mouse. i Flow cytometry of MDSC from CT26 allografts mice showed that surface PD-L1 protein on MDSC were induced in tumors compared with spleen, which was impaired in SLC25A22 knockout tumors (spleen: n = 3; tumors: n = 10). Each dot represents an independent sample. j SB265610 suppressed the growth of CT26-sgControl allografts (n = 10) and k downregulated MDSC (n = 9), but had no effect on CT26-Slc-KO allografts in BALB/c mice. MDSC positively correlated with tumor weight (n = 36). Each dot represents an independent tumor. Data are shown as mean ± SD. Two-tailed one-way ANOVA (b—d, f, h–k). Two-tailed Student’s t test analysis for two-group comparison e. Spearman correlation test (g, k). Source data are provided as a Source Data file.

