Figure 1.
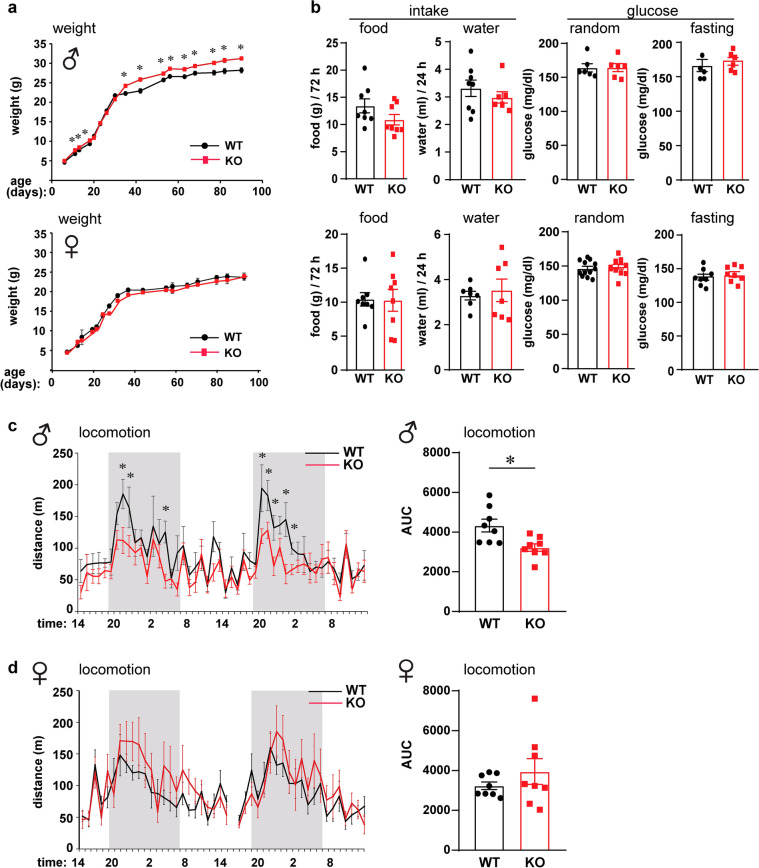
Fmr1 knockout (KO) male mice are heavier than controls. (a) Litter sizes were normalized to 8 mice per litter, weight of 4 litters per genotype monitored from p7-p90, and Fmr1 KO mice compared to wild-type FVB controls (WT) (KO, red; WT controls, black; males, top; females, bottom). n = 12–16 mice, points represent group mean ± standard error. Statistical significance between weight at each age is represented with * (p < 0.05, ANOVA followed by Tukey’s post hoc test). (b) Food (left) and water (right) intake were not different (cumulative, n = 8 per genotype); glucose levels (random, left; measured after overnight fasting, right) were not different (WT, black bars represent group mean ± standard error, each black circle represents one animal; KO, red bars represent group mean ± standard error, each red square represents one animal). (c) Locomotion activity of male mice measured continuously with Phenomaster for 48 h. Left, x-axis indicates time of day, when monitoring started at 14:00 or 2 pm, shaded area represents dark cycle, lights off in our vivarium from 7 pm to 7 am; black line, WT; red line, Fmr1 KO; n = 8 mice, points represent group mean ± standard error; WT, black; KO, red. Right, area under the curve (AUC), WT, black bars represent group mean ± standard error, each black circle represents one animal; KO, red bars represent group mean ± standard error, each red square represents one animal. (d) Locomotion activity, female mice. Statistical significance (*, p < 0.05) was determined with t-test followed by Tukey’s post hoc test.

