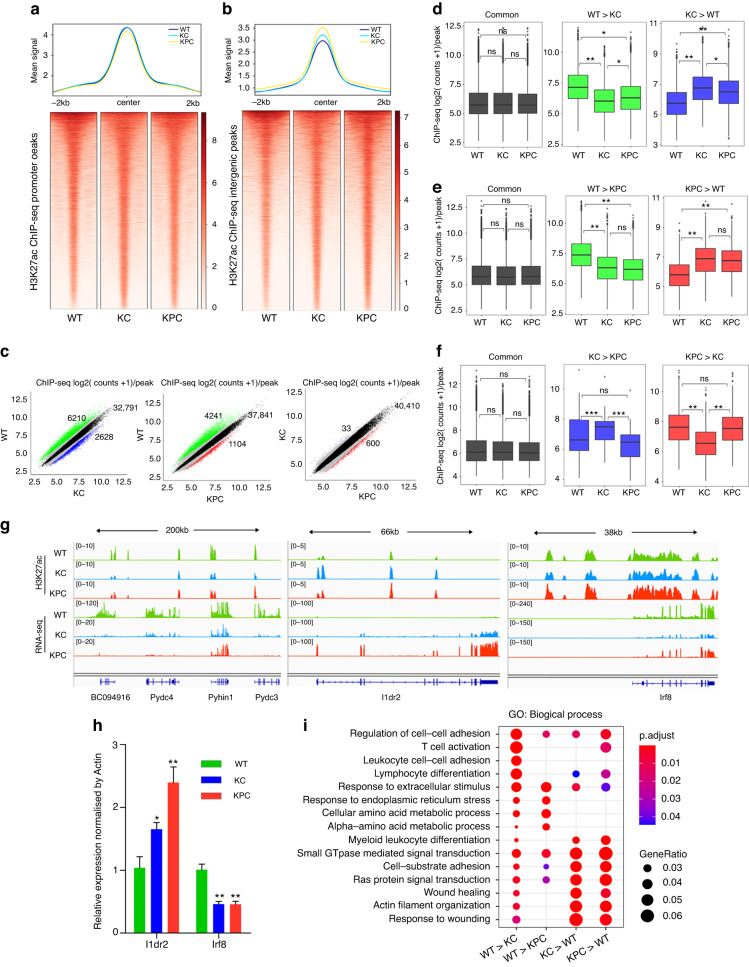
Fig. 2. Changes of H3K27ac signals in the PDAC mouse model.
a The average intensity curves (top panel) and heatmaps (bottom panel) for H3K27ac signals at promoter regions centred on the summit of peaks in WT, KC, and KPC mice. The region plotted comprises +/−2 Kb around the summit. b The average intensity curves (top panel) and heatmaps (bottom panel) for H3K27ac signals at intergenic regions centred on the summit of peaks in WT, KC, and KPC mice. The region plotted comprises +/−2 Kb around the summit. c Scatterplots of mean H3K27ac counts per peak comparing the indicated samples. Red indicates differential peaks enriched in KPC compared with WT or KC; Blue indicates differential peaks enriched in KC compared with WT or KPC; Green indicates differential peaks enriched in WT compared with KC or KPC; Black indicates common peaks whose fold-change is less than 2; Grey indicates the rest of peaks whose fold-change is greater than 2 as well as adjusted p-value greater than 1 × 10⁻². The upper-right number showed the count of common peaks. d–f Boxplots of H3K27ac counts per peak from the indicated samples (labelled at the bottom) at common or differentially H3K27ac regions from the comparison labelled above. Box indicates interquartile range with whiskers ±1.5 times this range and outlier points. g H3K27ac ChIP-seq and RNA-seq tracks around Pydc3, Ildr2, Irf8, etc., in WT, KC, and KPC mice. h RT-qPCR assay was performed to detect the expressions of indicated genes (labelled at the bottom) in WT, KC, and KPC mice. n = 4 for each group. The KC and KPC mice were compared with WT, respectively. *P < 0.05; **P < 0.01. i GO term analysis of differential H3K27ac peaks in indicated groups (labelled at the bottom).

