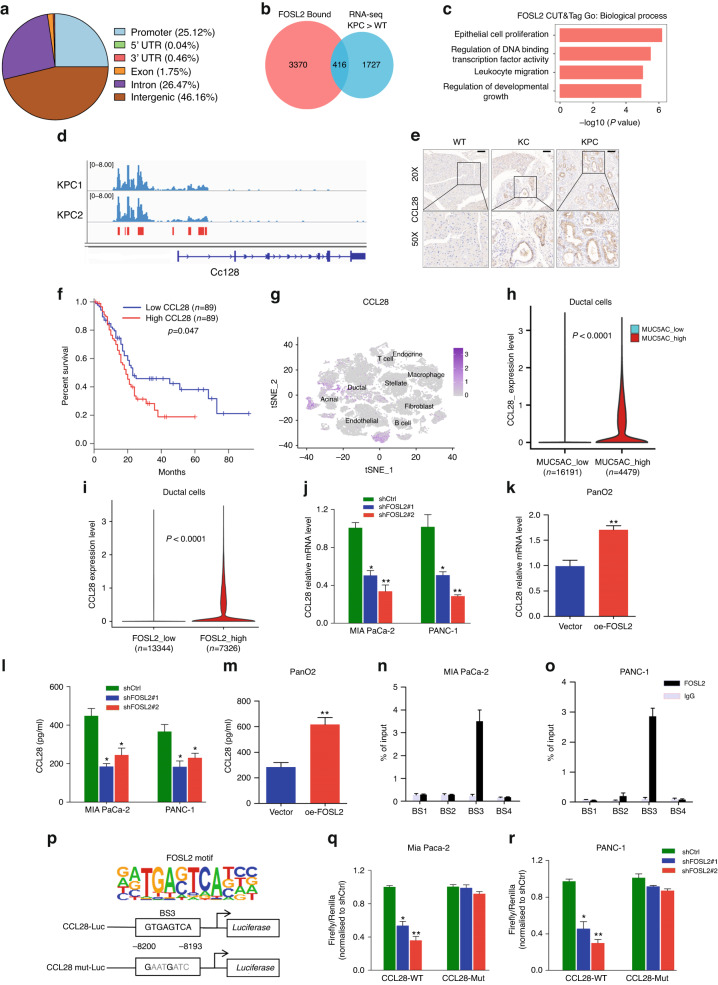
Fig. 6. CCL28 is a transcriptional target of FOSL2.
a Genomic distribution of FOSL2 CUT&Tag peaks. 5′UTR, 5′ untranslated region. 3′UTR, 3′ untranslated region. b Venn diagram outlining the overlap between FOSL2 target gene associations and 2,143 highly expressed genes in the KPC transcriptome than WT. c GO term analysis of FOSL2-regulated genes. d CUT&Tag signal track showing Ccl28-associated FOSL2 occupancy in KPC mice. e Representative images of IHC staining for CCL28 in WT pancreas, KC, and KPC neoplastic tissues. Scale bar, 100 μm. f OS of PDAC patients grouped by CCL28 mRNA expression. The survival data were obtained from the TCGA database. The high and low expression groups were defined using the median as the group cutoff. g Expression level of CCL28 for main cell types are plotted onto the t-SNE map. The colour key from grey to purple indicates relative expression levels from low to high. The “expression level” was normalised by the logNormalize method in Seurat. h Violin plot showing the global CCL28 expression level from scRNA-seq in the low MUC5AC ductal cell group and high MUC5AC ductal cell group. i RNA expression level of CCL28 in the indicated group in PDAC ductal cells from scRNA-seq data. The statistical test was carried out using the Wilcoxon rank-sum test. j, k CCL28 protein levels in MIA PaCa-2 and PANC-1 pancreatic cancer cells with FOSL2 knockdown (j) or in PanO2 cells with FOSL2 overexpression (k). For (j), the shFOSL2#1 and shFOSL2#2 groups were compared with the shCtrl group, respectively. l, m CCL28 protein in supernatants from MIA PaCa-2 and PANC-1 cells with FOSL2 knockdown (l), or from PanO2 cells with FOSL2 overexpression (m), as determined by ELISA. For (l), the shFOSL2#1 and shFOSL2#2 groups were compared with the shCtrl group, respectively. n, o ChIP analysis of the binding of FOSL2 to the CCL28 upstream in MIA PaCa-2 (N) and PANC-1(O) cells. p FOSL2 motif (top) and scheme of CCL28 upstream luciferase reporter constructs illustrating the wild-type or mutated sequences of potential FOSL2 binding sites (bottom). q, r Luciferase reporter activities of CCL28 upstream or upstream with mutated binding sites in MIA PaCa-2 (q) and PANC-1 (r) cells with stable FOSL2 knockdown. The shFOSL2#1 and shFOSL2#2 groups were compared with the shCtrl group, respectively. Data are representative of at least three independent experiments and shown as mean ± SEM. *P < 0.05; **P < 0.01.

