Figure 2.
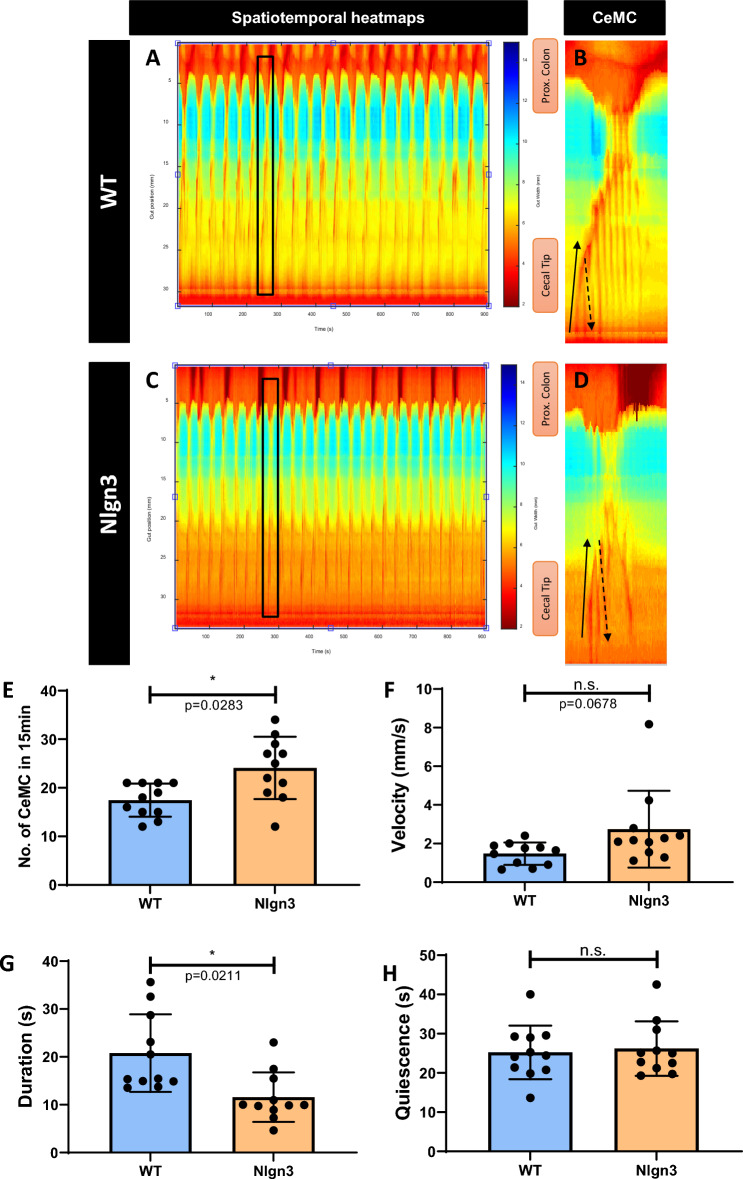
Cecal motility patterns are altered in Nlgn3R451C mice. (A–D) Representative spatiotemporal heatmaps of cecal motor complexes (CeMC) (denoted by black boxes and enlarged in (B,D) in (A-B) wildtype (WT) and (C,D) Nlgn3 mice. Forward contractions (FC) are denoted by black arrows and reverse contractions (RC) are denoted by dashed arrows. n = 11 in each group. (E) Nlgn3 mice have a higher number of CeMCin 15 min. (F) Velocity of CeMC between WT and Nlgn3 is not significantly different. (G) Duration of CeMC in Nlgn3 are shorter compared to WT. (H) No difference in quiescence period in WT and Nlgn3 mice. CeMC frequency was analysed using a Mann–Whitney statistical test. Other parameters of cecal motility were analysed using Student’s unpaired t-test. All measures of cecal motility were assessed using the Benjamini–Hochberg procedure to account for false discovery rate. Individual data and mean ± SD were plotted for n = 10–11 mice in each group. n.s. not significant. ns = p > 0.05, *p < 0.05. WT = wildtype; Nlgn3 = Nlgn3R451C.

