Figure 3.
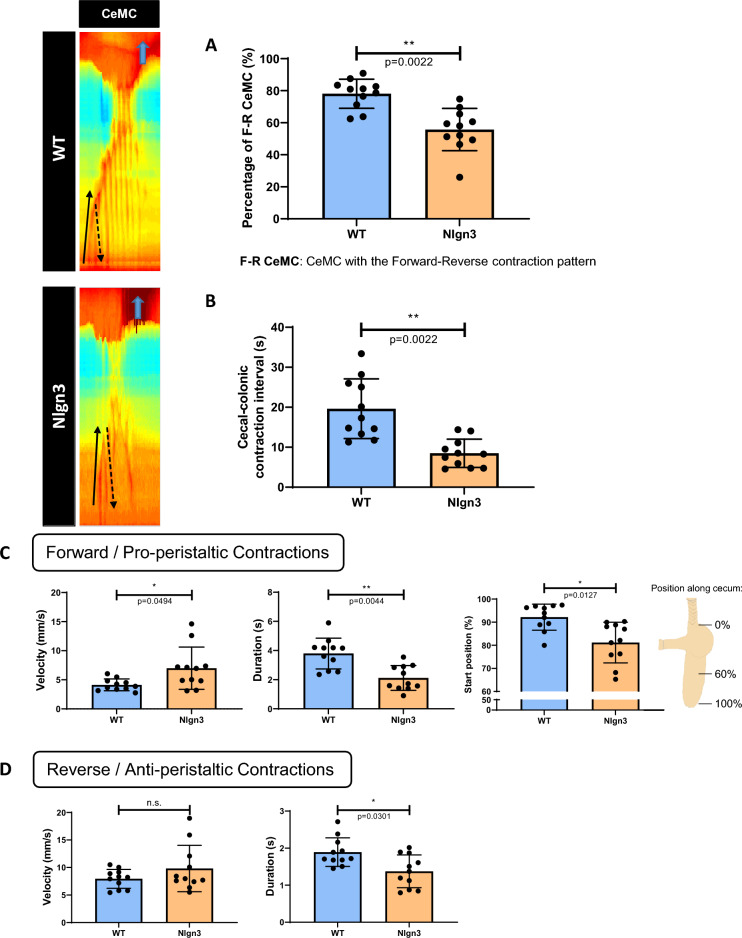
Altered cecal contraction patterns in Nlgn3R451C mice. (A) The percentage of CeMCs showing the contraction pattern is significantly lower in Nlgn3 mice. (B) The cecal-colonic contraction interval is significantly shorter in Nlgn3 mice. (C,D) Characteristics of individual contractions within CeMCs. (C) Alterations to velocity, duration, and start position of the forward contraction (FC) in Nlgn3 mice. (D) For reverse contractions (RC), the velocity is comparable, however their duration is shorter in Nlgn3 mice compared to WT. Cecal motility parameters were analysed using Student’s unpaired t-test. All measures of cecal motility were assessed using the Benjamini–Hochberg procedure to account for false discovery rate. Individual data and mean ± SD were plotted for n = 11 mice in each group. ns = p > 0.05, *p < 0.05, **p < 0.01. WT = wildtype; Nlgn3 = Nlgn3R451C.

