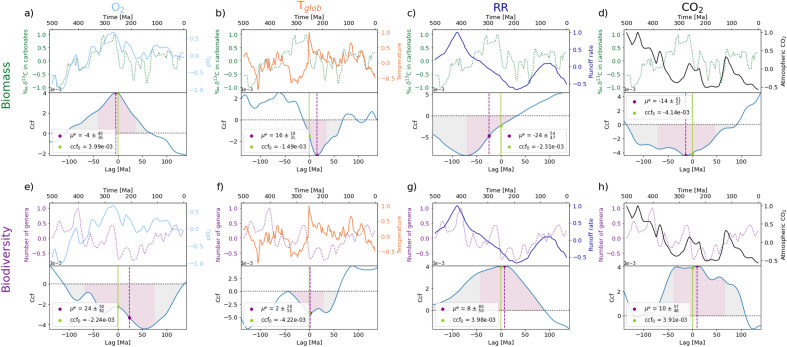
Figure 1.
Environmental and biological parameters through Earth history from 500 Ma before present until today and their corresponding cross-correlation functions (ccf). The ccf provides a correlation value of the two time series at a temporal lag of 0 (ccf0), as well as determines at which temporal lag (μ*) the time series exhibit a maximum correlation. The environmental parameters include in the upper panels of (a) through (h), respectively: mean atmospheric oxygen partial pressures pO2, global average surface temperatures Tglob, runoff rates RR, and atmospheric carbon dioxide levels CO2. The biological parameters include in the upper panels of (a) through (d) the primary productivity (in ‰ δ13C in carbonates) as a proxy for biomass (dashed dark green curves) and in the upper panels of (e) through (h) the biodiversity (number of genera) of marine fauna (dotted magenta curves). Each parameter was normalized to its maximum (absolute) value after the subtraction of its corresponding mean value. This way each time series fluctuates around 0 and has the same normalized units. Bottom panels of (a) through (h): Corresponding cross-correlation function (ccf). We constrained our analysis to a ± 25 Ma lag range since ever larger temporal ranges have a decreasing biogeochemical significance. The positive and negative errors with respect to μ* were calculated by determining the positive/negative temporal lags at which 34.15% of the total area between the ccf and the horizontal zero-line is encapsulated.

