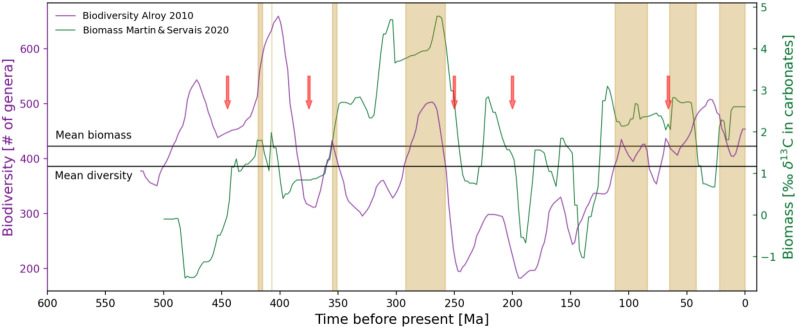
Figure 3.
Varying biomass and biodiversity values throughout the Phanerozoic. Vertically highlighted are time periods of a more thriving global biosphere relative to the Phanerozoic mean values, i.e. periods during which both the biomass production as well as the biological diversity were higher than their Phanerozoic means. The following mean values were calculated: biomass = 1.65 [‰δ13C in carbonates] for 500–0 Ma; biodiversity = 386 [number of genera] for 520–0 Ma. The red arrows represent the big five mass extinction events. A numerical synthesis of the average values for biomass, biodiversity as well as the accompanying environmental parameters (oxygen partial pressures, global average surface temperatures, runoff rates and atmospheric carbon dioxide) during periods of a more/less thriving biosphere compared to the Phanerozoic mean are presented in Table 2.

