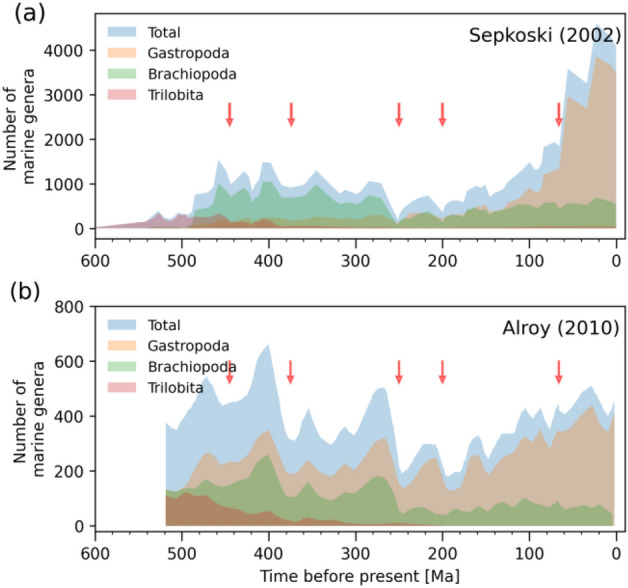
Figure 5.

Phanerozoic biodiversity curves. (a) Total Phanerozoic diversity based on raw data82 divided into its three main Evolutionary Faunas (EF), i.e. the Cambrian trilobites, the Paleozoic brachiopods, and the modern gastropods. These are three distinct types of fauna whose diversity pattern expanded and contracted in a similar fashion throughout the different phases of the Phanerozoic. Each EF includes specific taxonomic classes that were most abundant during (but not limited to) a certain period in Earth’s history. Furthermore, the EFs successively replaced one another as the principal group throughout the Phanerozoic. The red arrows represent the Big Five mass extinction events, including the Ordovician–Silurian extinction (~ 445 Ma ago), Devonian extinction (~ 375 Ma ago), Permian–Triassic extinction (~ 250 Ma ago), Triassic-Jurassic extinction (~ 200 Ma ago) and the Cretaceous-tertiary extinction (~ 66 Ma ago)81. (b) Corrected biodiversity curve using the shareholder quorum subsampling (SQS) sample standardization method34.
