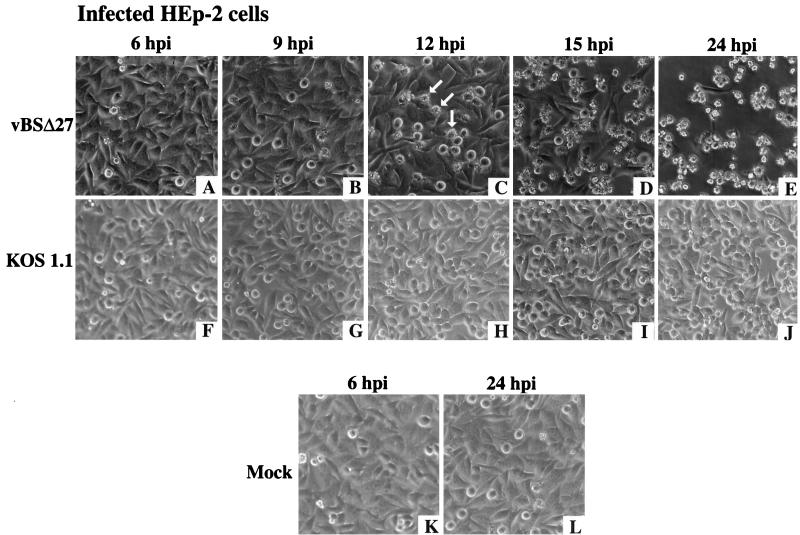
FIG. 4.
Morphologic changes during the course of infection in HEp-2 cells. Phase-contrast images of HEp-2 cells infected with vBSΔ27 (A to E) and KOS1.1 (F to J) at 6, 9, 12, 15, and 24 h p.i. were shown. Images of mock-infected cells (K and L) are shown at 6 and 24 h p.i. only. The arrows mark cells possessing the small, irregular phenotypes described in the text. Magnification, ×19.4.

