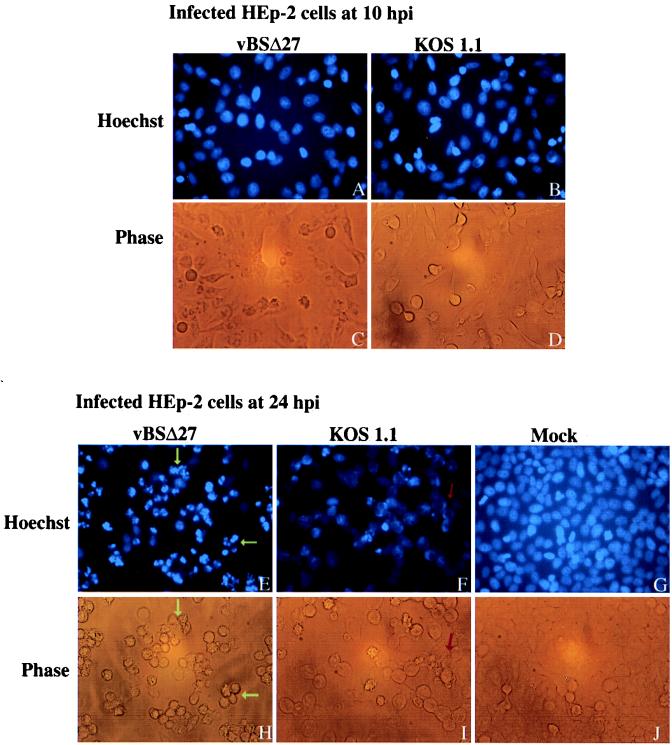
FIG. 6.
Fluorescent visualization of infected HEp-2 cell DNA. Fluorescent images (Hoechst) and corresponding phase-contrast images (Phase) of HEp-2 cells at 10 or 24 h after infection with vBSΔ27 or KOS1.1 and 24 h after mock infection. The infected cells were stained with the Hoechst H33258 DNA dye as described in Materials and Methods. Yellow arrows, condensed chromatin; red arrow, marginal chromatin. Fluorescent and phase-contrast microscopy magnification, ×20.

