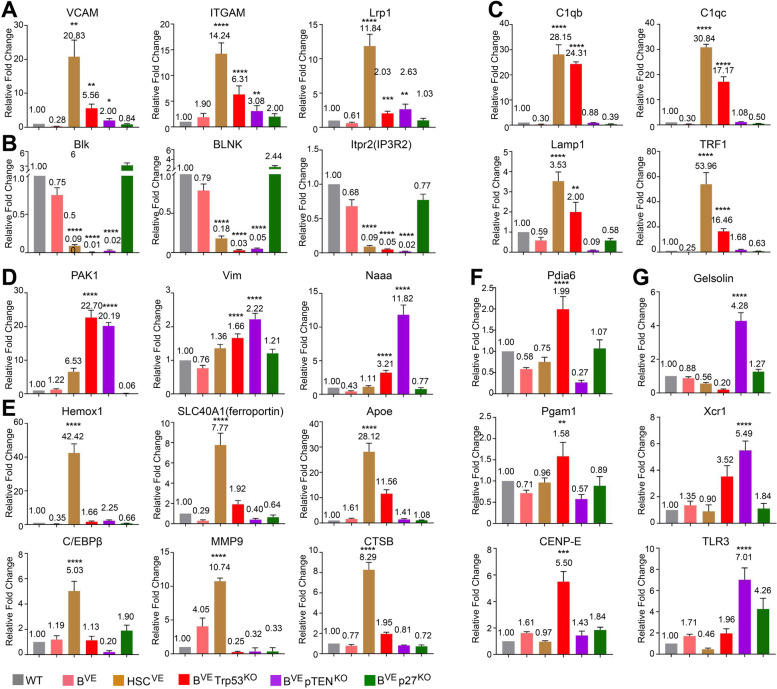
Fig. 6.
Quantitative PCR analysis of representative genes expressed by splenic HSCVE, BVETrp53KO or BVEpTENKO leukemic cells. A-G Quantitative PCR validation of representative genes in cellular programs altered in HSCVE, BVEP53−/− or BVEPTEN−/− leukemic cells. The qPCR analysis of representative genes was carried out as in Materials and Methods. A, representative genes for cell adhesion and phagocytosis that are up-regulated in all three leukemic cells. B, representative genes for BCR signaling or B cell function that are down-regulated in all three leukemic cells. C, representative genes for phagocytosis, iron homeostasis, and cell adhesion up-regulated in HSCVE and BVEP53−/− leukemic cells. D, representative genes for cell cytoskeleton and chemotaxis that are up-regulated in both BVEP53−/− and BVEPTEN−/− leukemic cells. E, representative genes for cellular iron homeostasis, inflammation and hyperproliferation/invasion that are highly expressed by HSCVE leukemic cells. F, representative genes for protein homeostasis and aerobic metabolism that are highly expressed by BVEP53−/− leukemic cells. G, representative genes for cell adhesion, antigen presentation, and pro-inflammatory signaling that are highly expressed by BVEPTEN−/− leukemic cells. In all experiments, splenic B cell RNAs were isolated from mice with disease at terminal stage or mice without disease at 28 weeks. All data are representative of at least five mice per group and three independent experiments. *p < 0.05, **p < 0.01, ***p < 0.001, ****p < 0.0001

