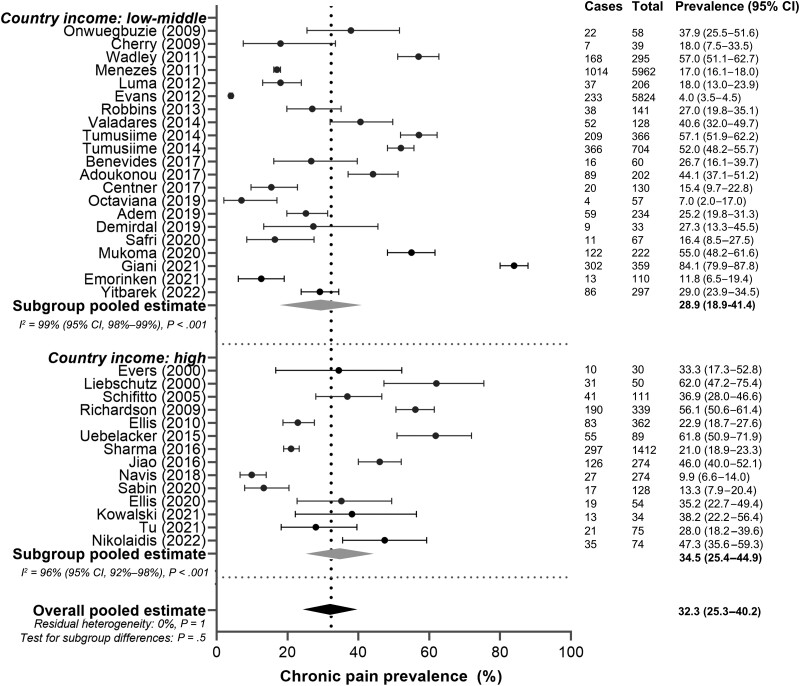
Figure 6.
Subgroup analysis of chronic pain prevalence in women with human immunodeficiency virus based on country where the study was conducted (low-middle vs high income). Cases: number of women with chronic pain in the study. Total: number of women enrolled in the study. Black circles indicate chronic pain prevalence in each study (with 95% confidence interval [CI]); gray diamonds indicate pooled prevalence of chronic pain within the subgroups; black diamond and a vertical dashed line indicate pooled estimate of chronic pain.

