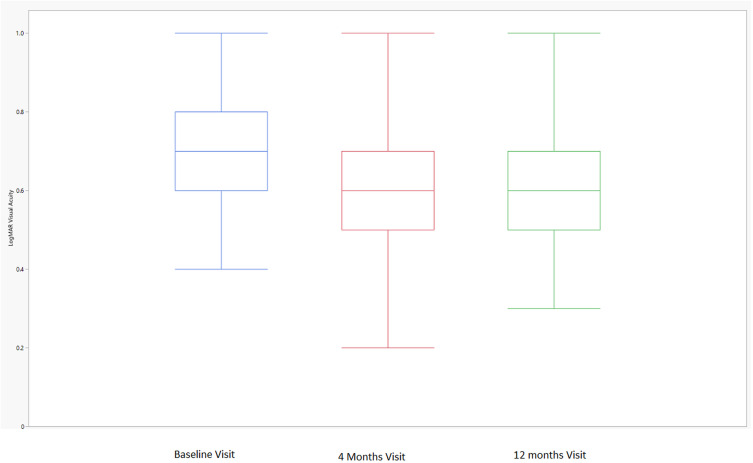
Figure 2.
LogMAR visual acuity over time. The box plot displays the median (line inside the box); interquartile range (the 25th percentile is the bottom of the box and the 75th percentile is the top of the box); and minimum and maximum observations within 1.5 × the interquartile range (upper and lower fences extending from the box).

