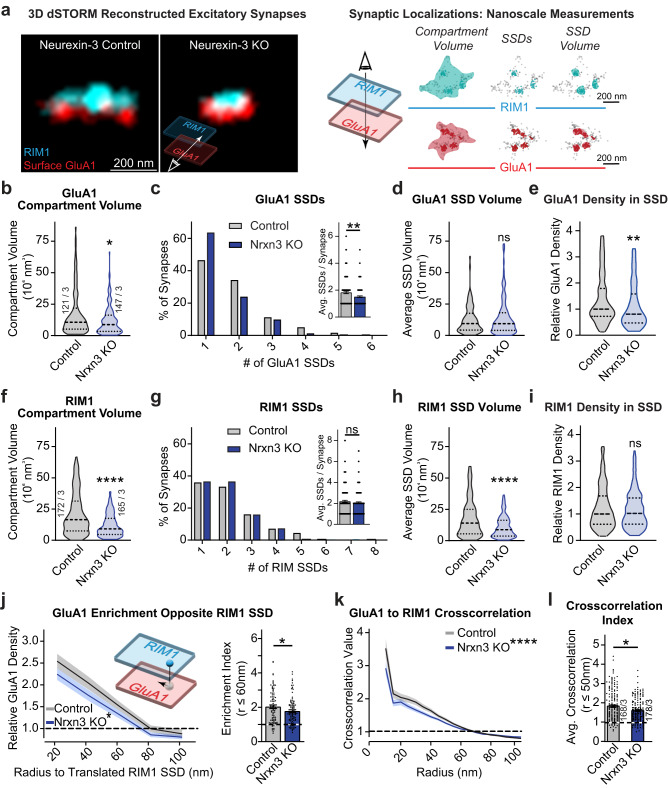
Fig. 1. Conditional deletion of Nrxn3 impairs nano-organization of GluA1 and RIM1 at excitatory synapses in the hippocampus.
a Representative 3D dSTORM images of presynaptic active zone maker RIM1 (cyan) and postsynaptic AMPA receptor subunit GluA1 (red) in Control and Nrxn3 knockout neurons (left). The schema used to quantify 3D dSTORM data (right). Nrxn3 KO reduces GluA1 compartment volume p = 0.0148 (b) and number of SSDs per synapse p = 0.0045 n = 122 control and 149 Nrxn3 KO synapses (c) but not SSD volume p = 0.8995 n = 115 and n = 135 synapses (d). Nrxn3 KO reduces the relative density of GluA1 in SSDs p = 0.0098 n = 103 synapses and n = 123 synapses (e). Significance: Mann–Whitney test (two-tailed). f–i Same quantification as (b–e) except for presynaptic RIM1. RIM1 compartment volume, p < 0.0001; SSDs per synapse, p = 0.5016 n = 191 control and n = 185 Nrxn3 KO synapses; SSD volume p < 0.0001 n = 163 control and n = 150 Nrxn3 KO synapses; relative density in SSDs p = 0.7732 n = 169 control and n = 160 Nrxn3 KO synapses. Significance: Mann–Whitney test (two-tailed). j Nrxn3 KO reduces transsynaptic enrichment of GluA1 relative to RIM1 SSDs, p = 0.0150 n = 87 control and n = 97 Nrxn3 KO SSDs and a reduction in the GluA1 transsynaptic enrichment index at radii ≤60 nm, p = 0.0471 n = 87 control and n = 97 Nrxn3 KO SSDs. Significance: 2-way repeated measures ANOVA main effect of Nrxn3 KO and Student’s t test (two-tailed) respectively. k, l Nrxn3 KO reduces GluA1 to RIM1 cross-correlation over 10–100 nm radius, p = 0.0001 n = 174 control and n = 188 Nrxn3 KO synapses; (k) and average cross-correlation at radii ≤50 nm, p = 0.0307 (l). Significance: 2-way repeated measures ANOVA main effect of radius x Nrxn3 KO; Mann–Whitney test (two-tailed). Data from three independent experiments. Number of synapses indicated on the graph unless stated in the legend. Bar graphs and line graphs: average ± SEM. Violin plots: median ± upper and lower quartiles. *p < 0.05; **p < 0.01. Source data are provided as a Source Data file.

