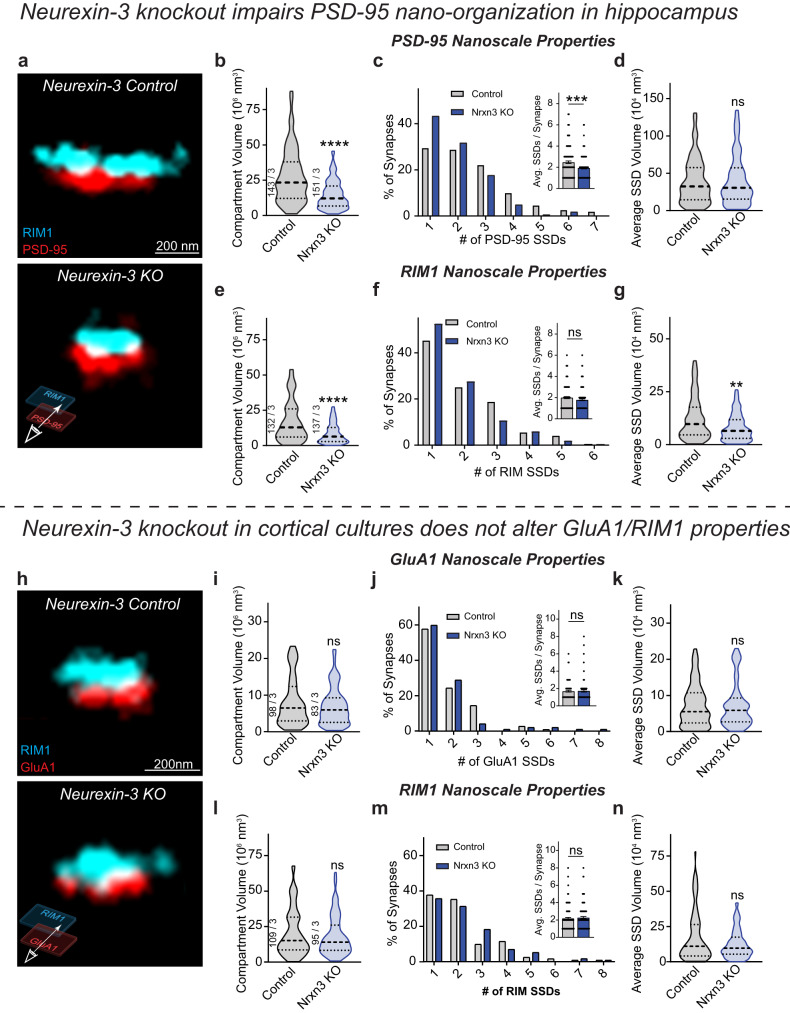
Fig. 2. Ablation of Nrxn3 impairs the nano-organization of PSD-95 in hippocampus.
a Reconstructed 3D dSTORM images of presynaptic RIM1 and postsynaptic PSD-95 in control (top) and Nrxn3 KO hippocampal neurons (bottom). Nrxn3 KO reduces PSD-95 compartment volume p < 0.0001 (b) and SSDs per synapse p = 0.0005 n = 149 control and n = 164 Nrxn3 KO synapses (c) without changing SSD volume p = 0.8609 n = 123 control and n = 136 Nrxn3 KO synapses (d). Significance: Mann–Whitney test (two-tailed). e–g Same as in (b–d) but for RIM1. RIM1 compartment volume, p < 0.0001; SSDs per synapse, p = 0.1097 n = 143 control and n = 148 Nrxn3 KO synapses; SSD volume, p = 0.0017 n = 115 control and 126 Nrxn3 KO synapses. Significance: Mann–Whitney test (two-tailed). h Reconstructed 3D dSTORM images of presynaptic RIM1 and postsynaptic surface GluA1 in control (top) and Nrxn3 KO cortical neurons (bottom). Nrxn3 KO does not alter nanoscale GluA1 properties including compartment volume p = 0.4802 (i), SSDs per synapse p = 0.6117 n = 111 control and n = 97 Nrxn3 KO synapses (j), or SSD volume p = 0.8620 n = 85 control and n = 72 Nrxn3 KO synapses (k). Significance: Mann–Whitney test (two-tailed). Nrxn3 KO results in no changes in nanoscale RIM1 properties including compartment volume p = 0.5918 (l), SSDs per synapse p = 0.5806 n = 122 control and n = 115 Nrxn3 KO synapses (m), or SSD volume p = 0.3018 n = 100 control and n = 96 Nrxn3 KO synapses (n). Significance: Mann–Whitney test (two-tailed). Data from three independent experiments. Number of synapses indicated on the graph unless stated in the legend. Bar graphs and line graphs: average ± SEM. Violin plots: median ± upper and lower quartiles. **p < 0.01; ***p < 0.001; ****p < 0.0001. Source data are provided as a Source Data file.

