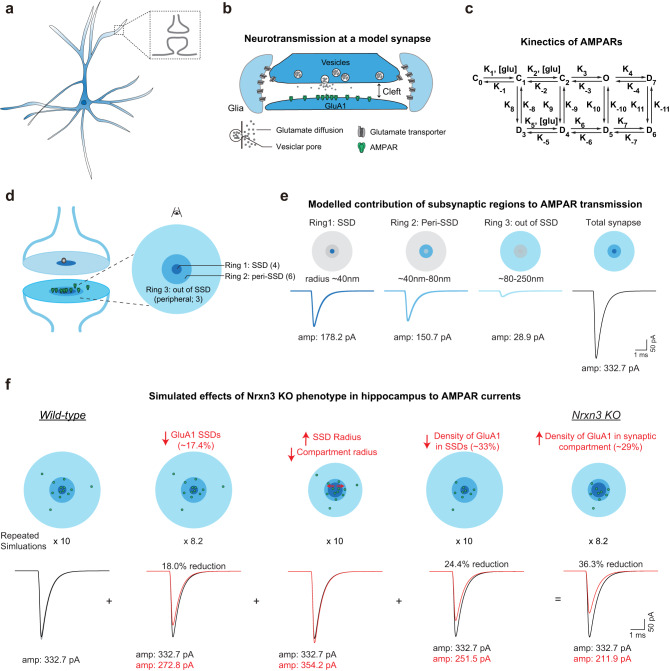
Fig. 3. Computational modeling of Nrxn3 conditional knockout hippocampal synapses shows deficits in AMPAR transmission.
a Schematic of pyramidal neuron and synapse. b Diagram of modeled synapse. c Schematic of AMPAR kinetics modeled in simulation. d Diagram of synapse indicating regions of AMPARs included in the simulation. e Isolation of the AMPAR current from three regions of the modeled synapse from left to right: Ring 1 which corresponds to GluA1 SSDs, Ring 2 the peri-SSD region, and Ring 3 which is peripheral to SSDs. f Computational simulation of potential effects on EPSC in Nrxn3 KO hippocampal neurons. From left to right, there are cartoons (above) and simulated EPSC traces (below) from WT (black), decreased GluA1 SSDs (red), altered SSD and compartment volumes (red), reduced density of GluA1 (red), and the cumulative effects after Nrxn3 KO (red). The gray traces in the left panel are 160 runs with release sites randomly distributed through the active zone, the black trace is the mean value. For parameters used, see Table 1. Schematic drawing in (b) is adapted from Han et al., 2022 (17). Source data are provided as a Source Data file.

